


You also want an ePaper? Increase the reach of your titles
YUMPU automatically turns print PDFs into web optimized ePapers that Google loves.
People<br />
www.tradersonline-mag.com 04.2014<br />
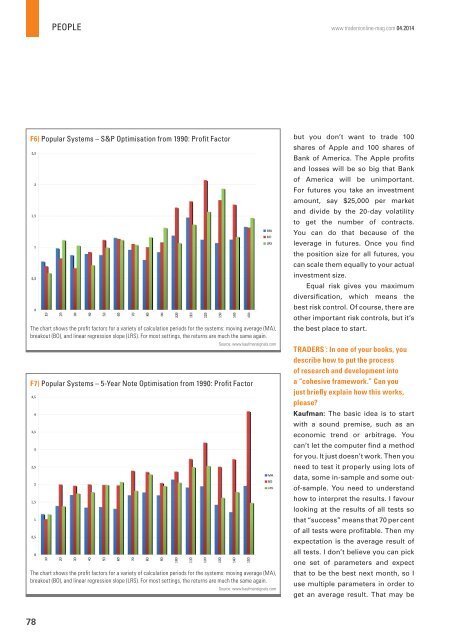
F6) Popular Systems – S&P Optimisation from 1990: Profit Factor<br />
The chart shows the profit factors for a variety of calculation periods for the systems: moving average (MA),<br />
breakout (BO), and linear regression slope (LRS). For most settings, the returns are much the same again.<br />
Source: www.kaufmansignals.com<br />
F7) Popular Systems – 5-Year Note Optimisation from 1990: Profit Factor<br />
The chart shows the profit factors for a variety of calculation periods for the systems: moving average (MA),<br />
breakout (BO), and linear regression slope (LRS). For most settings, the returns are much the same again.<br />
Source: www.kaufmansignals.com<br />
but you don’t want to trade 100<br />
shares of Apple and 100 shares of<br />
Bank of America. The Apple profits<br />
and losses will be so big that Bank<br />
of America will be unimportant.<br />
For futures you take an investment<br />
amount, say $25,000 per market<br />
and divide by the 20-day volatility<br />
to get the number of contracts.<br />
You can do that because of the<br />
leverage in futures. Once you find<br />
the position size for all futures, you<br />
can scale them equally to your actual<br />
investment size.<br />
Equal risk gives you maximum<br />
diversification, which means the<br />
best risk control. Of course, there are<br />
other important risk controls, but it’s<br />
the best place to start.<br />
TRADERS´: In one of your books, you<br />
describe how to put the process<br />
of research and development into<br />
a “cohesive framework.” Can you<br />
just briefly explain how this works,<br />
please<br />
Kaufman: The basic idea is to start<br />
with a sound premise, such as an<br />
economic trend or arbitrage. You<br />
can’t let the computer find a method<br />
for you. It just doesn’t work. Then you<br />
need to test it properly using lots of<br />
data, some in-sample and some outof-sample.<br />
You need to understand<br />
how to interpret the results. I favour<br />
looking at the results of all tests so<br />
that “success” means that 70 per cent<br />
of all tests were profitable. Then my<br />
expectation is the average result of<br />
all tests. I don’t believe you can pick<br />
one set of parameters and expect<br />
that to be the best next month, so I<br />
use multiple parameters in order to<br />
get an average result. That may be<br />
78