


You also want an ePaper? Increase the reach of your titles
YUMPU automatically turns print PDFs into web optimized ePapers that Google loves.
BASICS<br />
Taking signals against the dominant<br />
trend does not fit good trend followers.<br />
north or south. It can also gauge overextended market<br />
conditions as well as equilibrium phases.<br />
Computation:<br />
Calculations for the Momentum indicator may vary<br />
slightly depending on the preferences of the trader who<br />
sets it. But in general, a current closing price is viewed in<br />
relation to a particular duration of the previous closing<br />
price.<br />
Current closing price: CP<br />
Previous closing price: CPn<br />
Therefore: M = CP - CPn Or M = (CP / CPn) * 100<br />
Basically, the momentum value is the latest closing<br />
price as a percentage of the previous closing price.<br />
does not fit good trend followers. What fits us is what<br />
fits us. A rope is not fit for a chicken’s neck. After taking<br />
a trade with this indicator, you may want to exit the trade<br />
when the indicator is going contrary to it. This can really<br />
save you from coming surprises when the market starts<br />
going against you.<br />
Though, the Momentum indicator can stand as a<br />
strategy on its own, it appears to work more powerfully<br />
when combined with another trend identifying<br />
indicator, for we want to take signals only in the<br />
direction of the overall bias. Figure 4 shows how the<br />
Momentum is combined with the MACD, which allows<br />
more convincing trend confirmation as well as taking<br />
signals in favour of the dominant trend only, even if the<br />
market is jumpy (volatile). This is what trend followers<br />
want.<br />
Conclusion<br />
Taking Signals from the Momentum Indicator<br />
In part 7 of this series we’ll discuss these indicators:<br />
This indicator is good for generating signals on Money Flow Index and Moving Average of Oscillator. «<br />
instruments that trend significantly<br />
and on instruments that move<br />
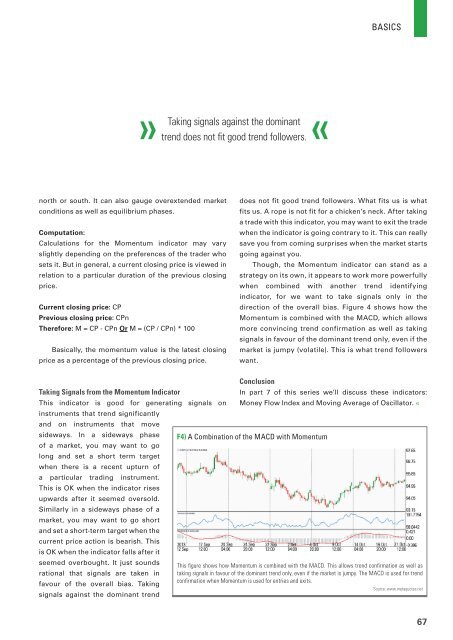
sideways. In a sideways phase F4) A Combination of the MACD with Momentum<br />
of a market, you may want to go<br />
long and set a short term target<br />
when there is a recent upturn of<br />
a particular trading instrument.<br />
This is OK when the indicator rises<br />
upwards after it seemed oversold.<br />
Similarly in a sideways phase of a<br />
market, you may want to go short<br />
and set a short-term target when the<br />
current price action is bearish. This<br />
is OK when the indicator falls after it<br />
seemed overbought. It just sounds This figure shows how Momentum is combined with the MACD. This allows trend confirmation as well as<br />
rational that signals are taken in taking signals in favour of the dominant trend only, even if the market is jumpy. The MACD is used for trend<br />
confirmation when Momentum is used for entries and exits.<br />
favour of the overall bias. Taking<br />
Source: www.metaquotes.net<br />
signals against the dominant trend<br />
67