


You also want an ePaper? Increase the reach of your titles
YUMPU automatically turns print PDFs into web optimized ePapers that Google loves.
strategies<br />
markets, Relative Strength (RS) and correlation, to<br />
find and filter trading signals.<br />
Simplicity is considered a desirable trait in a trading<br />
strategy and this style of analysis does carry the risk of<br />
having rules that are overly complex. A guiding principle<br />
in developing this idea was to fall on the side of simple<br />
and straightforward in the calculations and signals by<br />
restricting them to these two relationships.<br />
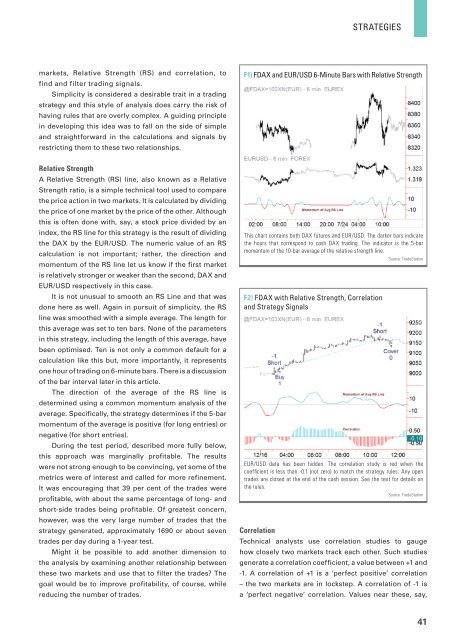
F1) FDAX and EUR/USD 6-Minute Bars with Relative Strength<br />
Relative Strength<br />
A Relative Strength (RS) line, also known as a Relative<br />
Strength ratio, is a simple technical tool used to compare<br />
the price action in two markets. It is calculated by dividing<br />
the price of one market by the price of the other. Although<br />
this is often done with, say, a stock price divided by an<br />
index, the RS line for this strategy is the result of dividing<br />
the DAX by the EUR/USD. The numeric value of an RS<br />
calculation is not important; rather, the direction and<br />
momentum of the RS line let us know if the first market<br />
is relatively stronger or weaker than the second, DAX and<br />
EUR/USD respectively in this case.<br />
It is not unusual to smooth an RS Line and that was<br />
done here as well. Again in pursuit of simplicity, the RS<br />
line was smoothed with a simple average. The length for<br />
this average was set to ten bars. None of the parameters<br />
in this strategy, including the length of this average, have<br />
been optimised. Ten is not only a common default for a<br />
calculation like this but, more importantly, it represents<br />
one hour of trading on 6-minute bars. There is a discussion<br />
of the bar interval later in this article.<br />
The direction of the average of the RS line is<br />
determined using a common momentum analysis of the<br />
average. Specifically, the strategy determines if the 5-bar<br />
momentum of the average is positive (for long entries) or<br />
negative (for short entries).<br />
During the test period, described more fully below,<br />
this approach was marginally profitable. The results<br />
were not strong enough to be convincing, yet some of the<br />
metrics were of interest and called for more refinement.<br />
It was encouraging that 39 per cent of the trades were<br />
profitable, with about the same percentage of long- and<br />
short-side trades being profitable. Of greatest concern,<br />
however, was the very large number of trades that the<br />
strategy generated, approximately 1690 or about seven<br />
trades per day during a 1-year test.<br />
Might it be possible to add another dimension to<br />
the analysis by examining another relationship between<br />
these two markets and use that to filter the trades The<br />
goal would be to improve profitability, of course, while<br />
reducing the number of trades.<br />
This chart contains both DAX futures and EUR/USD. The darker bars indicate<br />
the hours that correspond to cash DAX trading. The indicator is the 5-bar<br />
momentum of the 10-bar average of the relative strength line.<br />
Source: TradeStation<br />
F2) FDAX with Relative Strength, Correlation<br />
and Strategy Signals<br />
EUR/USD data has been hidden. The correlation study is red when the<br />
coefficient is less than -0.1 (not zero) to match the strategy rules. Any open<br />
trades are closed at the end of the cash session. See the text for details on<br />
the rules.<br />
Source: TradeStation<br />
Correlation<br />
Technical analysts use correlation studies to gauge<br />
how closely two markets track each other. Such studies<br />
generate a correlation coefficient, a value between +1 and<br />
-1. A correlation of +1 is a ‘perfect positive’ correlation<br />
– the two markets are in lockstep. A correlation of -1 is<br />
a ‘perfect negative’ correlation. Values near these, say,<br />
41