


You also want an ePaper? Increase the reach of your titles
YUMPU automatically turns print PDFs into web optimized ePapers that Google loves.
iNSiGhTS<br />
cent and one winner of 25 per cent. Average return in that<br />
case would be a mere ((1 + 0.01 x 9 + 1.25) - 1) / 10 or 3.4 per<br />
Dirk vandycke<br />
cent. If that were not so or the effect was negligible that<br />
Dirk Vandycke has been actively and independently<br />
studying the markets since 1995 with a focus on<br />
could only mean that the original returns must be very<br />
technical analysis, market dynamics and behavioural<br />
finance. He writes articles on a regular basis and<br />
close to each other in which case diversification didn’t<br />
develops software partly available at his co-owned<br />
change a thing other than perhaps increasing transaction<br />
website www.chartmill.com. He teaches software<br />
development and statistics at a Belgian University.<br />
costs and again lowering return.<br />
dirk@monest.net<br />
To look at this another way if diversification is<br />
contradictory to expectancy, then concentration seems<br />
to be the only valid option.<br />
Of course all this raises the question if this doesn’t return of both portfolios was captured. So the interval<br />
increase risk to unacceptable levels Let’s leave that the reference portfolio got monitored depended on<br />
question for later and first turn to experimental, well the moment the last stock of the pruning portfolio was<br />
practical if you want, proof of all this. To address this we stopped out. Hence a period ‘specific to the test’. From<br />
made use of a Monte Carlo simulation.<br />
the thousands of tests that were run, some portfolio’s<br />
only lasted a few weeks while others took more than a<br />
A Huge Simulation<br />
year to get stopped out of their last holdings. So of course<br />
The experiment I ran gave diversification the benefit by now you must be wondering what the results of this<br />
of the doubt. We used a database of several tens of experiment were. Here’s what we got.<br />
thousands of stocks (excluding low volume stocks, very<br />
low priced stock, non-regulated markets, overly volatile Results<br />
stocks and the like). Stocks were monitored over several Take a look at the average return in Figure 2. There you<br />
decades, including a wide range of market conditions. have 13 grey lines depicting the equity curves of all<br />
The Monte Carlo simulator ran (and in the end averaged) 13 holdings in the pruning portfolio. As you will notice,<br />
several thousands of tests, each one going like this. some got drawn over a longer time interval than others,<br />
First a portfolio was made of 13 randomly chosen depending on how long they stayed in the portfolio. The<br />
stocks over a period specific to that test (I’ll explain this un-interrupted black line is the equity curve of the pruning<br />
in a moment). Initial capital was equally divided between portfolio becoming more and more concentrated, while<br />
all 13 stocks. The computer then ran each portfolio in the dashed black line shows the equity curve of the<br />
two copies. One copy was kept as a reference which was homogenously diversified reference portfolio. Keep in<br />
called the homogenous diversified portfolio. One might mind that these are averaged equity curves of the actual<br />
refer to this as an non-weighted index. The other copy did<br />
something very simple to get rid of<br />
the diversification and move over to<br />
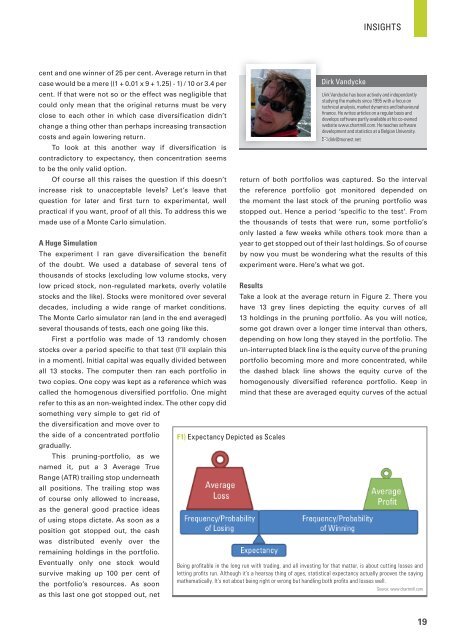
the side of a concentrated portfolio F1) Expectancy Depicted as Scales<br />
gradually.<br />
This pruning-portfolio, as we<br />
named it, put a 3 Average True<br />
Range (ATR) trailing stop underneath<br />
all positions. The trailing stop was<br />
of course only allowed to increase,<br />
as the general good practice ideas<br />
of using stops dictate. As soon as a<br />
position got stopped out, the cash<br />
was distributed evenly over the<br />
remaining holdings in the portfolio.<br />
Eventually only one stock would<br />
Being profi table in the long run with trading, and all investing for that matter, is about cutting losses and<br />
survive making up 100 per cent of letting profi ts run. Although it’s a hearsay thing of ages, statistical expectancy actually prooves the saying<br />
mathematically. It’s not about being right or wrong but handling both profi ts and losses well.<br />
the portfolio’s resources. As soon<br />
Source: www.chartmill.com<br />
as this last one got stopped out, net<br />
19