


You also want an ePaper? Increase the reach of your titles
YUMPU automatically turns print PDFs into web optimized ePapers that Google loves.
BASICS<br />
Two days later I was able to hold<br />
through the volatility because I was using<br />
end of day stop losses.<br />
Scaling-In<br />
Two days later I was able to hold through the volatility<br />
because I was using end of day stop losses. My original<br />
stop was SPY closing below the 10 day moving average<br />
thus invalidating the break out. It sliced through but<br />
quickly recovered to close higher. Three days later SPY<br />
was able to close above the 50 day moving average with<br />
power. So I added the other half of my account ($130,000)<br />
to bring my position size to $260,000 total. I moved my<br />
end of day stop at this point to under the 50 day.<br />
I held as SPY gapped up and was in a price base for<br />
a few days. I then moved my end of day stop to the 5<br />
day exponential moving average. After a few days it<br />
then gapped up again to $170 and finished at the low of<br />
the day with a nasty black candle.<br />
I stayed in and kept my stop at the<br />
5 day exponential line. In my trading F1) SPY Trade<br />
I have not found one black candle to<br />
mean much, it usually even resumes<br />
the trend after a day like that. It did<br />
recover the next day after the black<br />
candle, I was still in.<br />
may go parabolic at that point I thought. No such luck,<br />
buyers were not coming in over $173 at all on Thursday<br />
and SPY was very extended over the 5 day exponential<br />
moving average. With most of my reward already having<br />
happened and more risk of a retracement back to the<br />
5 day line than possible gain to the upside I decided to<br />
take my profits and I would probably have a chance to get<br />
back in with a better entry as the 5 day line caught back<br />
up to price.<br />
Conclusion<br />
It was a great trading campaign and I ended with an<br />
almost $11,000 profit in two weeks of holding a very<br />
stable position in a low risk index. I’ll take it. «<br />
Exit<br />
Then came the FOMC day (Federal<br />
Open Market Committee). I had to<br />
follow the chart and stay long with<br />
it sitting right at all time highs with<br />
a catalyst on tap. Everyone that<br />
wanted risk off was likely out and<br />
waiting to get back in when the coast<br />
was clear. Everyone waited for the<br />
word “taper”, when it was steady<br />
as she goes the SPY exploded up<br />
to over $173 then came back to<br />
close at $173 on the day. I held, we<br />
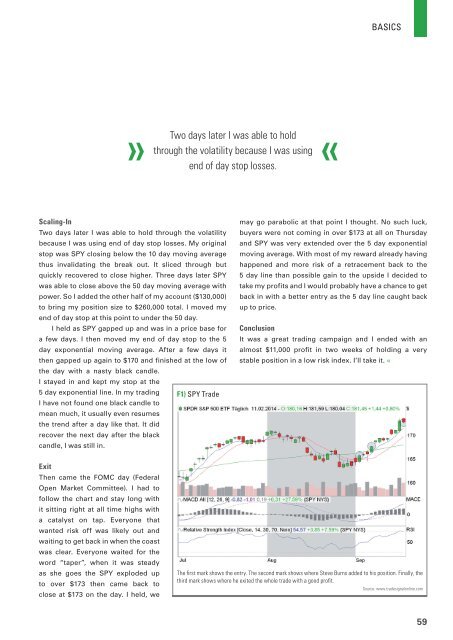
The first mark shows the entry. The second mark shows where Steve Burns added to his position. Finally, the<br />
third mark shows where he exited the whole trade with a good profit.<br />
Source: www.tradesignalonline.com<br />
59