


You also want an ePaper? Increase the reach of your titles
YUMPU automatically turns print PDFs into web optimized ePapers that Google loves.
BASICS<br />
The strategy consists of waiting<br />
for the breakout of one of the box<br />
extremes and trade in this direction.<br />
» Darvas Boxes<br />
The Darvas Boxes study follows the basics of any<br />
other price channel patterns based study: While price<br />
remains inside the range, we assume that the price<br />
movement is going to follow its normal course for a<br />
while. However, if some of the extremes are broken by<br />
price action, the expected reaction will be a change in<br />
the price behaviour and probably the beginning of a<br />
new trend. In the following article we will explain the<br />
functioning of this tool and also the trading rules to be<br />
used with it.<br />
Calculating the Limits<br />
Before going into detail on the information provided by<br />
the Darvas boxes, we are going to explain their calculation<br />
procedures.<br />
The high and low levels formed by each of the boxes<br />
are obtained by following these<br />
steps:<br />
1. We establish the top price of the<br />
box at the high of the current<br />
session.<br />
2. Once this top has been obtained,<br />
we monitor price to see if this<br />
level is broken by the price<br />
action during the following two<br />
sessions. If this level is broken,<br />
we start again.<br />
3. If we find a top that has not<br />
been violated over the latest two<br />
sessions, we save it and store the<br />
low price of the current session<br />
as a base for the box.<br />
4. Now we note this base and<br />
monitor it over the following two<br />
sessions, in order to see if the<br />
base is violated or not. If the base<br />
is violated, we move back to step<br />
3, in other words, we update the<br />
base again. Likewise, if the top<br />
value of the box is violated by the price action, then<br />
we move back again to the beginning, this being step<br />
1.<br />
5. If step 5 is reached, a Darvas Box will be consolidated<br />
and will be formed by the duo TOP/BASE that has not<br />
been violated, at least, over the latest two sessions.<br />
After step 5 the process is repeated by keeping the<br />
last box until a new one appears.<br />
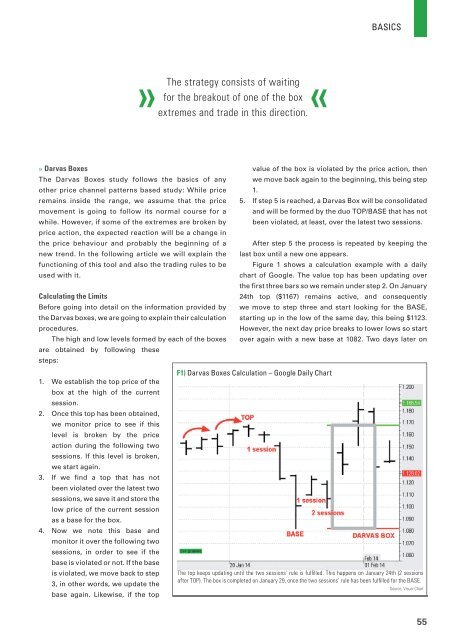
Figure 1 shows a calculation example with a daily<br />
chart of Google. The value top has been updating over<br />
the first three bars so we remain under step 2. On January<br />
24th top ($1167) remains active, and consequently<br />
we move to step three and start looking for the BASE,<br />
starting up in the low of the same day, this being $1123.<br />
However, the next day price breaks to lower lows so start<br />
over again with a new base at 1082. Two days later on<br />
F1) Darvas Boxes Calculation – Google Daily Chart<br />
The top keeps updating until the two sessions’ rule is fulfilled. This happens on January 24th (2 sessions<br />
after TOP). The box is completed on January 29, once the two sessions’ rule has been fulfilled for the BASE.<br />
Source: Visual Chart<br />
55