

Download PDF (2.5MB) - Anchor Environmental
Download PDF (2.5MB) - Anchor Environmental
Download PDF (2.5MB) - Anchor Environmental

You also want an ePaper? Increase the reach of your titles
YUMPU automatically turns print PDFs into web optimized ePapers that Google loves.
5.12 What determines success<br />
Based on the estimates made in this study, there was a wide range in the degree of success of<br />
different operators. Indeed, success varied within most of the different regions, suggesting that<br />
several factors must have been at play.<br />
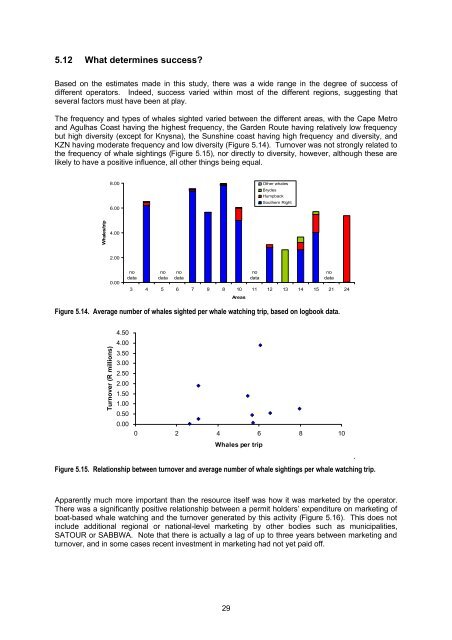
The frequency and types of whales sighted varied between the different areas, with the Cape Metro<br />
and Agulhas Coast having the highest frequency, the Garden Route having relatively low frequency<br />
but high diversity (except for Knysna), the Sunshine coast having high frequency and diversity, and<br />
KZN having moderate frequency and low diversity (Figure 5.14). Turnover was not strongly related to<br />
the frequency of whale sightings (Figure 5.15), nor directly to diversity, however, although these are<br />
likely to have a positive influence, all other things being equal.<br />
8.00<br />
6.00<br />
Other whales<br />
Brydes<br />
Humpback<br />
Southern Right<br />
Whales/trip<br />
4.00<br />
2.00<br />
0.00<br />
no<br />
data<br />
no<br />
data<br />
no<br />
data<br />
3 4 5 6 7 9 8 10 11 12 13 14 15 21 24<br />
Areas<br />
no<br />
data<br />
no<br />
data<br />
Figure 5.14. Average number of whales sighted per whale watching trip, based on logbook data.<br />
Turnover (R millions)<br />
4.50<br />
4.00<br />
3.50<br />
3.00<br />
2.50<br />
2.00<br />
1.50<br />
1.00<br />
0.50<br />
0.00<br />
0 2 4 6 8 10<br />
Whales per trip<br />
.<br />
Figure 5.15. Relationship between turnover and average number of whale sightings per whale watching trip.<br />
Apparently much more important than the resource itself was how it was marketed by the operator.<br />
There was a significantly positive relationship between a permit holders’ expenditure on marketing of<br />
boat-based whale watching and the turnover generated by this activity (Figure 5.16). This does not<br />
include additional regional or national-level marketing by other bodies such as municipalities,<br />
SATOUR or SABBWA. Note that there is actually a lag of up to three years between marketing and<br />
turnover, and in some cases recent investment in marketing had not yet paid off.<br />
29


