

Download PDF (2.5MB) - Anchor Environmental
Download PDF (2.5MB) - Anchor Environmental
Download PDF (2.5MB) - Anchor Environmental

You also want an ePaper? Increase the reach of your titles
YUMPU automatically turns print PDFs into web optimized ePapers that Google loves.
Number of passengers<br />
20,000<br />
18,000<br />
16,000<br />
14,000<br />
12,000<br />
10,000<br />
8,000<br />
6,000<br />
4,000<br />
2,000<br />
0<br />
1999 2000 2001 2002 2003 2004<br />
West Coast<br />
Cape Metro<br />
Agulhas<br />
Garden Route<br />
Sunshine coast (PE)<br />
Hibiscus (Shelly)<br />
Zululand (RB)<br />
Maputaland (St Lucia)<br />
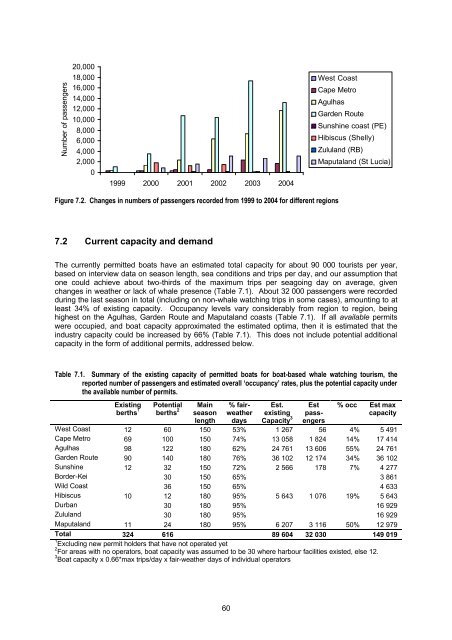
Figure 7.2. Changes in numbers of passengers recorded from 1999 to 2004 for different regions<br />
7.2 Current capacity and demand<br />
The currently permitted boats have an estimated total capacity for about 90 000 tourists per year,<br />
based on interview data on season length, sea conditions and trips per day, and our assumption that<br />
one could achieve about two-thirds of the maximum trips per seagoing day on average, given<br />
changes in weather or lack of whale presence (Table 7.1). About 32 000 passengers were recorded<br />
during the last season in total (including on non-whale watching trips in some cases), amounting to at<br />
least 34% of existing capacity. Occupancy levels vary considerably from region to region, being<br />
highest on the Agulhas, Garden Route and Maputaland coasts (Table 7.1). If all available permits<br />
were occupied, and boat capacity approximated the estimated optima, then it is estimated that the<br />
industry capacity could be increased by 66% (Table 7.1). This does not include potential additional<br />
capacity in the form of additional permits, addressed below.<br />
Table 7.1. Summary of the existing capacity of permitted boats for boat-based whale watching tourism, the<br />
reported number of passengers and estimated overall ‘occupancy’ rates, plus the potential capacity under<br />
the available number of permits.<br />
Existing<br />
berths 1<br />
Potential<br />
berths 2<br />
Main<br />
season<br />
length<br />
% fairweather<br />
days<br />
Est.<br />
existing<br />
Capacity 3<br />
Est<br />
passengers<br />
% occ Est max<br />
capacity<br />
West Coast 12 60 150 53% 1 267 56 4% 5 491<br />
Cape Metro 69 100 150 74% 13 058 1 824 14% 17 414<br />
Agulhas 98 122 180 62% 24 761 13 606 55% 24 761<br />
Garden Route 90 140 180 76% 36 102 12 174 34% 36 102<br />
Sunshine 12 32 150 72% 2 566 178 7% 4 277<br />
Border-Kei 30 150 65% 3 861<br />
Wild Coast 36 150 65% 4 633<br />
Hibiscus 10 12 180 95% 5 643 1 076 19% 5 643<br />
Durban 30 180 95% 16 929<br />
Zululand 30 180 95% 16 929<br />
Maputaland 11 24 180 95% 6 207 3 116 50% 12 979<br />
Total 324 616 89 604 32 030 149 019<br />
1 Excluding new permit holders that have not operated yet<br />
2 For areas with no operators, boat capacity was assumed to be 30 where harbour facilities existed, else 12.<br />
3 Boat capacity x 0.66*max trips/day x fair-weather days of individual operators<br />
60


