MCDA Final Report Malawi - Standards and Trade Development ...
MCDA Final Report Malawi - Standards and Trade Development ...
MCDA Final Report Malawi - Standards and Trade Development ...

You also want an ePaper? Increase the reach of your titles
YUMPU automatically turns print PDFs into web optimized ePapers that Google loves.
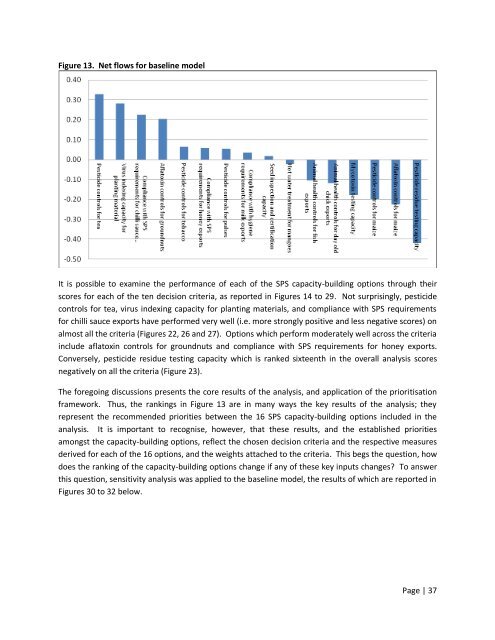
Figure 13. Net flows for baseline model<br />
It is possible to examine the performance of each of the SPS capacity-building options through their<br />
scores for each of the ten decision criteria, as reported in Figures 14 to 29. Not surprisingly, pesticide<br />
controls for tea, virus indexing capacity for planting materials, <strong>and</strong> compliance with SPS requirements<br />
for chilli sauce exports have performed very well (i.e. more strongly positive <strong>and</strong> less negative scores) on<br />
almost all the criteria (Figures 22, 26 <strong>and</strong> 27). Options which perform moderately well across the criteria<br />
include aflatoxin controls for groundnuts <strong>and</strong> compliance with SPS requirements for honey exports.<br />
Conversely, pesticide residue testing capacity which is ranked sixteenth in the overall analysis scores<br />
negatively on all the criteria (Figure 23).<br />
The foregoing discussions presents the core results of the analysis, <strong>and</strong> application of the prioritisation<br />
framework. Thus, the rankings in Figure 13 are in many ways the key results of the analysis; they<br />
represent the recommended priorities between the 16 SPS capacity-building options included in the<br />
analysis. It is important to recognise, however, that these results, <strong>and</strong> the established priorities<br />
amongst the capacity-building options, reflect the chosen decision criteria <strong>and</strong> the respective measures<br />
derived for each of the 16 options, <strong>and</strong> the weights attached to the criteria. This begs the question, how<br />
does the ranking of the capacity-building options change if any of these key inputs changes To answer<br />
this question, sensitivity analysis was applied to the baseline model, the results of which are reported in<br />
Figures 30 to 32 below.<br />
Page | 37