

nymtc regional freight plan - New York Metropolitan Transportation ...
nymtc regional freight plan - New York Metropolitan Transportation ...
nymtc regional freight plan - New York Metropolitan Transportation ...

You also want an ePaper? Increase the reach of your titles
YUMPU automatically turns print PDFs into web optimized ePapers that Google loves.
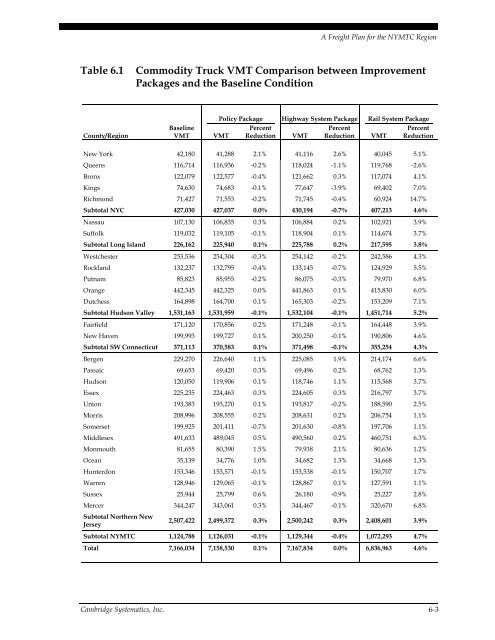
A Freight Plan for the NYMTC Region<br />
Table 6.1<br />
Commodity Truck VMT Comparison between Improvement<br />
Packages and the Baseline Condition<br />
County/Region<br />
Baseline<br />
VMT<br />
Policy Package Highway System Package Rail System Package<br />
VMT<br />
Percent<br />
Reduction<br />
VMT<br />
Percent<br />
Reduction<br />
VMT<br />
Percent<br />
Reduction<br />
<strong>New</strong> <strong>York</strong> 42,180 41,288 2.1% 41,116 2.6% 40,045 5.1%<br />
Queens 116,714 116,936 -0.2% 118,024 -1.1% 119,768 -2.6%<br />
Bronx 122,079 122,577 -0.4% 121,662 0.3% 117,074 4.1%<br />
Kings 74,630 74,683 -0.1% 77,647 -3.9% 69,402 7.0%<br />
Richmond 71,427 71,553 -0.2% 71,745 -0.4% 60,924 14.7%<br />
Subtotal NYC 427,030 427,037 0.0% 430,194 -0.7% 407,213 4.6%<br />
Nassau 107,130 106,835 0.3% 106,884 0.2% 102,921 3.9%<br />
Suffolk 119,032 119,105 -0.1% 118,904 0.1% 114,674 3.7%<br />
Subtotal Long Island 226,162 225,940 0.1% 225,788 0.2% 217,595 3.8%<br />
Westchester 253,536 254,304 -0.3% 254,142 -0.2% 242,586 4.3%<br />
Rockland 132,237 132,795 -0.4% 133,145 -0.7% 124,929 5.5%<br />
Putnam 85,823 85,955 -0.2% 86,075 -0.3% 79,970 6.8%<br />
Orange 442,345 442,325 0.0% 441,863 0.1% 415,830 6.0%<br />
Dutchess 164,898 164,700 0.1% 165,303 -0.2% 153,209 7.1%<br />
Subtotal Hudson Valley 1,531,163 1,531,959 -0.1% 1,532,104 -0.1% 1,451,714 5.2%<br />
Fairfield 171,120 170,856 0.2% 171,248 -0.1% 164,448 3.9%<br />
<strong>New</strong> Haven 199,993 199,727 0.1% 200,250 -0.1% 190,806 4.6%<br />
Subtotal SW Connecticut 371,113 370,583 0.1% 371,498 -0.1% 355,254 4.3%<br />
Bergen 229,270 226,640 1.1% 225,085 1.9% 214,174 6.6%<br />
Passaic 69,653 69,420 0.3% 69,496 0.2% 68,762 1.3%<br />
Hudson 120,050 119,906 0.1% 118,746 1.1% 115,568 3.7%<br />
Essex 225,235 224,463 0.3% 224,605 0.3% 216,797 3.7%<br />
Union 193,383 193,270 0.1% 193,817 -0.2% 188,590 2.5%<br />
Morris 208,996 208,555 0.2% 208,631 0.2% 206,754 1.1%<br />
Somerset 199,925 201,411 -0.7% 201,630 -0.8% 197,706 1.1%<br />
Middlesex 491,633 489,045 0.5% 490,560 0.2% 460,751 6.3%<br />
Monmouth 81,655 80,390 1.5% 79,938 2.1% 80,636 1.2%<br />
Ocean 35,139 34,776 1.0% 34,682 1.3% 34,668 1.3%<br />
Hunterdon 153,346 153,571 -0.1% 153,538 -0.1% 150,707 1.7%<br />
Warren 128,946 129,065 -0.1% 128,867 0.1% 127,591 1.1%<br />
Sussex 25,944 25,799 0.6% 26,180 -0.9% 25,227 2.8%<br />
Mercer 344,247 343,061 0.3% 344,467 -0.1% 320,670 6.8%<br />
Subtotal Northern <strong>New</strong><br />
Jersey<br />
2,507,422 2,499,372 0.3% 2,500,242 0.3% 2,408,601 3.9%<br />
Subtotal NYMTC 1,124,788 1,126,031 -0.1% 1,129,344 -0.4% 1,072,293 4.7%<br />
Total 7,166,034 7,158,530 0.1% 7,167,834 0.0% 6,836,963 4.6%<br />
Cambridge Systematics, Inc. 6-3


