- Page 1 and 2:
COLD ADAPTATION STRATEGIES AND DIVE
- Page 3 and 4:
, 71 "If you march your Winter Jour
- Page 5 and 6:
1.6.3. Molecular typing techniques
- Page 7 and 8:
3.2.1.2.3. DOC and chlorophyll a ..
- Page 9 and 10:
5.3.2.5. The Sphingomonas group, is
- Page 11 and 12:
LIST OF FIGURES Figure I. I. Diagra
- Page 13 and 14:
Figure 3.17a Mean bacterial abundan
- Page 15 and 16: LIST OF TABLES Table 1.1. Types of
- Page 17 and 18: List of Abbreviations AFP AFGP AFLP
- Page 19 and 20: ACKNOWLEDGEMENTS This study was fun
- Page 21 and 22: Chapter 1: INTRODUCTION 1.1 - Tempe
- Page 23 and 24: 1999 ; Hand & Burton, 1981) or iden
- Page 25 and 26: Cold adaptation is dependant on the
- Page 27 and 28: not at 25°C is a function of the a
- Page 29 and 30: The most prolific literature on col
- Page 31 and 32: process known as thermal hysteresis
- Page 33 and 34: dominant, role in the ice-growth in
- Page 35 and 36: explanation for this diversity is t
- Page 37 and 38: 1.5.3.5 - Membrane bound solute tra
- Page 39 and 40: een well established (Russell & Nic
- Page 41 and 42: & Bowman, 2001; Labrenz & Hirsch, 2
- Page 43 and 44: The reaction mix contains both deox
- Page 45 and 46: gene mixtures and hence can be used
- Page 47 and 48: displaying a high number of common
- Page 49 and 50: AACGTCGAAA AACCTCGAAA (Organism A)
- Page 51 and 52: particular set of environmental par
- Page 53 and 54: Lake Maximum Depth (m) Approximate
- Page 55 and 56: Larsemann Hills __ rp3rtrnent of th
- Page 57 and 58: Sampling trips took two days during
- Page 59 and 60: Sigma, Sigma-Aldrich Company Ltd.,
- Page 61 and 62: oxidized and the sample then conver
- Page 63 and 64: sample. An appropriate volume was l
- Page 65: min to ensure complete extension of
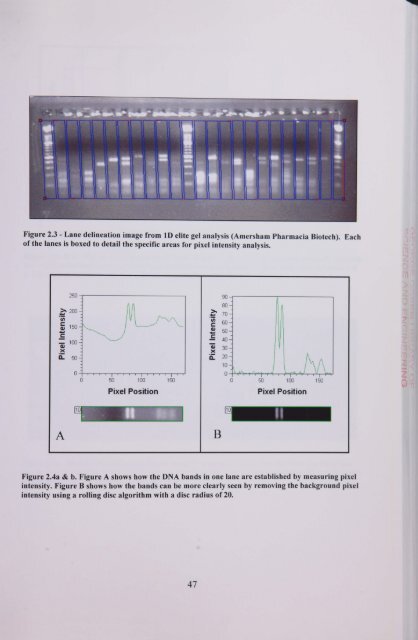
- Page 69 and 70: Figure 2.6b - Molecular weights are
- Page 71 and 72: RNA 41F (5'-GCT CAG ATT GAA CGC TGG
- Page 73 and 74: I min. The spin column was removed
- Page 75 and 76: compiled using Seqman and any erron
- Page 77 and 78: ecorded and related to the level of
- Page 79 and 80: information regarding the cold adap
- Page 81 and 82: 50ppt to 186ppt. Thirteen were sali
- Page 83 and 84: M N N 't M M \p \p 00 kf) M kf) bA
- Page 85 and 86: as would normally be expected, as b
- Page 87 and 88: 1444 6ý L CC vý O Q O O NO u 'c z
- Page 89 and 90: 5 - 250 3 245 240 G (, -3 235 a 0-
- Page 91 and 92: 3.2.2.2.5 - Dissolved organic carbo
- Page 93 and 94: d 14 12 10 14 12 7 10 8 6 4 2 0 00/
- Page 95 and 96: SRP ('g L- 05 10 15 20 2 3 Depth4 5
- Page 97 and 98: 3.2.2.3 - Biological characteristic
- Page 99 and 100: a 0 Bacterial Abundance (x 106 ml-1
- Page 101 and 102: 3.3 - Discussion 3.3.1 - Summer sam
- Page 103 and 104: to high surface water temperatures
- Page 105 and 106: chemocline (Rankin et al., 1999). M
- Page 107 and 108: a 250 200 150 100 50 70 60 50 40 ý
- Page 109 and 110: The temperature (Fig 3.2a) through
- Page 111 and 112: et al., 1999). No melt out was obse
- Page 113 and 114: increase in ammonium is probably du
- Page 115 and 116: 10 7 9 6 8 E ö 7 5 Co u c m c 40 w
- Page 117 and 118:
main pigments were chlorophylls a a
- Page 119 and 120:
Inorganic nitrogen (NO2, NO3 and NH
- Page 121 and 122:
744 -- 7 644 6 19 ü SE 400-- 4 2s
- Page 123 and 124:
salinity decreased from July to Sep
- Page 125 and 126:
a Bacterial abundance (x 106 1.1) 0
- Page 127 and 128:
8 ö a N Ö oý L _> Q O O 4 0 rn O
- Page 129 and 130:
undoubtedly true of Club Lake. The
- Page 131 and 132:
suggested that input of bacteria an
- Page 133 and 134:
Pendant Lake is an unstratified, sa
- Page 135 and 136:
non-AFP active peptides from inhibi
- Page 137 and 138:
. ter rý :. 'ý Figure 4.2 -Fryka
- Page 139 and 140:
-ý- ---- ,. r. __-_-. ___. r. ýý
- Page 141 and 142:
4.2 - Results 4.2.1 - Sampling and
- Page 143 and 144:
SPLAT score. It has been shown that
- Page 145 and 146:
3'E t ý _d M! .PJ r rn 15 3.5 4 3
- Page 147 and 148:
4.3 - Discussion Of the 866 bacteri
- Page 149 and 150:
arisen in very few species due to c
- Page 151 and 152:
Chapter 5: BACTERIAL MOLECULAR TYPI
- Page 153 and 154:
Fig 5.1 - Photographs of ARDRA gel
- Page 155 and 156:
Coefficient: Dice Algorithm: lPGMAA
- Page 157 and 158:
The closest published relative for
- Page 159 and 160:
identification was made based on 15
- Page 161 and 162:
Isolate number Closest phylogenetic
- Page 163 and 164:
e included due to its small sequenc
- Page 165 and 166:
5.3.2 - Identification of the AFP a
- Page 167 and 168:
explains the fluctuation in related
- Page 169 and 170:
contamination was lower as the PCR
- Page 171 and 172:
seen to a certain extent in the ARD
- Page 173 and 174:
American Type Culture Collection (A
- Page 175 and 176:
Phylogenetic cluster alignment of t
- Page 177 and 178:
et al., 1994) and the Antarctic SIM
- Page 179 and 180:
Chapter 6: BACTERIAL COMMUNITY ANAL
- Page 181 and 182:
6.2.1 - Detection of AFP active iso
- Page 183 and 184:
using the same PCR protocol as orig
- Page 185 and 186:
Figure 6.1 - Denaturing gradient ge
- Page 187 and 188:
6.2.2 - Temporal and spatial variat
- Page 189 and 190:
Figure 6.4c - Gel I image showing b
- Page 191 and 192:
Coefficient: Dice Algorithm: UPGMA
- Page 193 and 194:
etween Om and 2m was obviously the
- Page 195 and 196:
All PCR-based rRNA molecular techni
- Page 197 and 198:
6.3.2.3 - Cellular lysis and DNA pu
- Page 199 and 200:
hybrids should be equal. However, S
- Page 201 and 202:
contain contaminants. If the profil
- Page 203 and 204:
(Section 6.3.2.4.3 ) could not be r
- Page 205 and 206:
most dominant species in the commun
- Page 207 and 208:
study was characterised as M protea
- Page 209 and 210:
11 species) showed AFP activity. Th
- Page 211 and 212:
that AFP activity could have evolve
- Page 213 and 214:
7.2 - Future Work The 19 AFP active
- Page 215 and 216:
REFERENCES ABYZOV, S. S. (1993). Mi
- Page 217 and 218:
BELL, E. M. and LAYBOURN-PARRY, J.
- Page 219 and 220:
Symposium on Environmental Biogeoch
- Page 221 and 222:
Research. 5,477-493. CLESCERI, L. S
- Page 223 and 224:
DRICKAMER, K. (1999). C-type lectin
- Page 225 and 226:
antifreeze proteins from Atlantic s
- Page 227 and 228:
FRANZMANN, P. D. and DOBSON, S. J.
- Page 229 and 230:
GRIFFITH, M., ALA, P., YANG. D. S.
- Page 231 and 232:
IVANOVA, E. P., KIPRIANOVA, E. A.,
- Page 233 and 234:
Antarctic Ecosystems. G. A. Llano (
- Page 235 and 236:
Howard-Williams and I. Hawes). Balk
- Page 237 and 238:
W. (1998). Rep-PCR-mediated genomic
- Page 239 and 240:
putida strains from Antarctica. Mic
- Page 241 and 242:
NICHOLS, D., BOWMAN, J., SANDERSON,
- Page 243 and 244:
PEARCE, D. A. and BUTLER, H. G. (20
- Page 245 and 246:
(1999). Palaeohydrological modellin
- Page 247 and 248:
tracers of biogeochemical processes
- Page 249 and 250:
R. G. Landes Company, Austin, Texas
- Page 251 and 252:
partial 16S rDNA sequencing. Applie
- Page 253 and 254:
YABUUCHI, E., WANG, L., ARAKAWA, M.
- Page 255 and 256:
APPENDICES Al. Media Tryptic Soya A
- Page 257 and 258:
"D C 'O I. .. r .. r 6 rr E , 4mo .
- Page 259 and 260:
. + + + I I I I I I + I + + I I I I
- Page 261 and 262:
Ö ON N M 1 O - N 'zt "o l'" 00 C N
- Page 263 and 264:
1 T 1 1 1 1 1 1 1 1 1 1 1 1 1 1 1 1
- Page 265 and 266:
1 1 1 1 1 1 1 1 1 1 1 1 1 1 1 1 1 1
- Page 267 and 268:
1 1 1 1 I 1 + I I 1 I 1 1 I 1 1 1 I
- Page 269 and 270:
1 1 1 1 1 1 1 I I 1 I 1 I 1 1 I T I
- Page 271 and 272:
Cl M 'tt tn '. p t- 00 O\ N M O - (
- Page 273 and 274:
d' O - (N M 'nt V) \O N. 00 O> N M
- Page 275 and 276:
1 1 T 1 1 1 T 1 1 1 1 1 1 1 1 1 1 1
- Page 277 and 278:
+ + i i i i i i " i " . + + + + " +
- Page 279 and 280:
e O --ý N M t Vn 1,0 [-- 00 O> N M
- Page 281 and 282:
FT ce + I I r. to \, O t- 00 O\ N M
- Page 283 and 284:
kn 110 r- 00 Oý N M O - N M Itt vn
- Page 285 and 286:
, It N M "t N M Iýt N M M M M Oý
- Page 287 and 288:
gj a - - - - - - - - - - - - - - -


