SOCIOLOLINGUISTIC SURVEYS - Centre for Language Studies
SOCIOLOLINGUISTIC SURVEYS - Centre for Language Studies
SOCIOLOLINGUISTIC SURVEYS - Centre for Language Studies

Create successful ePaper yourself
Turn your PDF publications into a flip-book with our unique Google optimized e-Paper software.
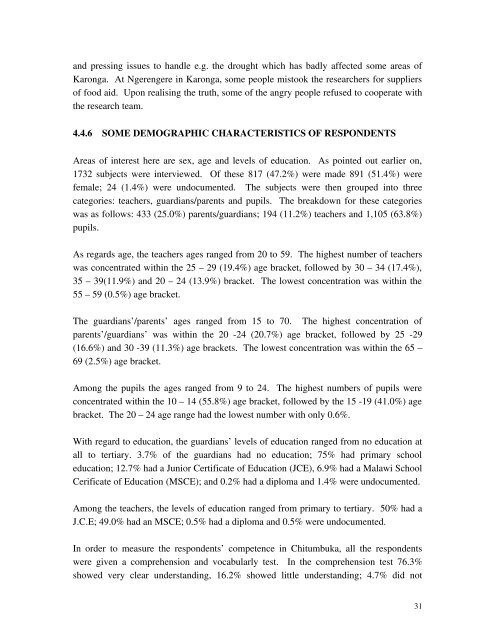
and pressing issues to handle e.g. the drought which has badly affected some areas of<br />
Karonga. At Ngerengere in Karonga, some people mistook the researchers <strong>for</strong> suppliers<br />
of food aid. Upon realising the truth, some of the angry people refused to cooperate with<br />
the research team.<br />
4.4.6 SOME DEMOGRAPHIC CHARACTERISTICS OF RESPONDENTS<br />
Areas of interest here are sex, age and levels of education. As pointed out earlier on,<br />
1732 subjects were interviewed. Of these 817 (47.2%) were made 891 (51.4%) were<br />
female; 24 (1.4%) were undocumented. The subjects were then grouped into three<br />
categories: teachers, guardians/parents and pupils. The breakdown <strong>for</strong> these categories<br />
was as follows: 433 (25.0%) parents/guardians; 194 (11.2%) teachers and 1,105 (63.8%)<br />
pupils.<br />
As regards age, the teachers ages ranged from 20 to 59. The highest number of teachers<br />
was concentrated within the 25 – 29 (19.4%) age bracket, followed by 30 – 34 (17.4%),<br />
35 – 39(11.9%) and 20 – 24 (13.9%) bracket. The lowest concentration was within the<br />
55 – 59 (0.5%) age bracket.<br />
The guardians’/parents’ ages ranged from 15 to 70. The highest concentration of<br />
parents’/guardians’ was within the 20 24 (20.7%) age bracket, followed by 25 29<br />
(16.6%) and 30 39 (11.3%) age brackets. The lowest concentration was within the 65 –<br />
69 (2.5%) age bracket.<br />
Among the pupils the ages ranged from 9 to 24. The highest numbers of pupils were<br />
concentrated within the 10 – 14 (55.8%) age bracket, followed by the 15 19 (41.0%) age<br />
bracket. The 20 – 24 age range had the lowest number with only 0.6%.<br />
With regard to education, the guardians’ levels of education ranged from no education at<br />
all to tertiary. 3.7% of the guardians had no education; 75% had primary school<br />
education; 12.7% had a Junior Certificate of Education (JCE), 6.9% had a Malawi School<br />
Cerificate of Education (MSCE); and 0.2% had a diploma and 1.4% were undocumented.<br />
Among the teachers, the levels of education ranged from primary to tertiary. 50% had a<br />
J.C.E; 49.0% had an MSCE; 0.5% had a diploma and 0.5% were undocumented.<br />
In order to measure the respondents’ competence in Chitumbuka, all the respondents<br />
were given a comprehension and vocabularly test. In the comprehension test 76.3%<br />
showed very clear understanding, 16.2% showed little understanding; 4.7% did not<br />
31