SOCIOLOLINGUISTIC SURVEYS - Centre for Language Studies
SOCIOLOLINGUISTIC SURVEYS - Centre for Language Studies
SOCIOLOLINGUISTIC SURVEYS - Centre for Language Studies

Create successful ePaper yourself
Turn your PDF publications into a flip-book with our unique Google optimized e-Paper software.
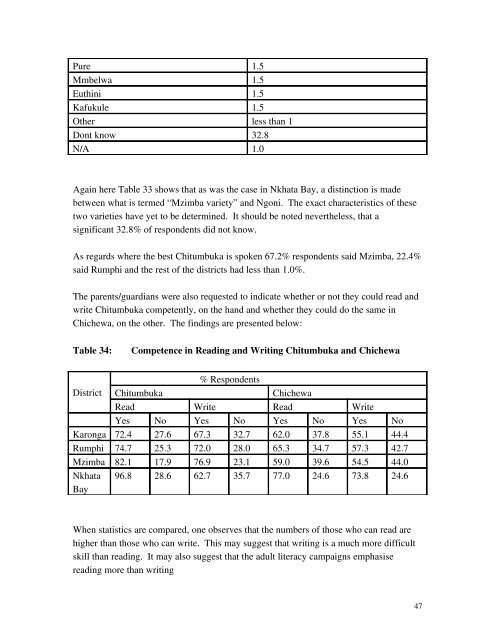
Pure 1.5<br />
Mmbelwa 1.5<br />
Euthini 1.5<br />
Kafukule 1.5<br />
Other less than 1<br />
Dont know 32.8<br />
N/A 1.0<br />
Again here Table 33 shows that as was the case in Nkhata Bay, a distinction is made<br />
between what is termed “Mzimba variety” and Ngoni. The exact characteristics of these<br />
two varieties have yet to be determined. It should be noted nevertheless, that a<br />
significant 32.8% of respondents did not know.<br />
As regards where the best Chitumbuka is spoken 67.2% respondents said Mzimba, 22.4%<br />
said Rumphi and the rest of the districts had less than 1.0%.<br />
The parents/guardians were also requested to indicate whether or not they could read and<br />
write Chitumbuka competently, on the hand and whether they could do the same in<br />
Chichewa, on the other. The findings are presented below:<br />
Table 34:<br />
Competence in Reading and Writing Chitumbuka and Chichewa<br />
% Respondents<br />
District Chitumbuka<br />
Chichewa<br />
Read Write Read Write<br />
Yes No Yes No Yes No Yes No<br />
Karonga 72.4 27.6 67.3 32.7 62.0 37.8 55.1 44.4<br />
Rumphi 74.7 25.3 72.0 28.0 65.3 34.7 57.3 42.7<br />
Mzimba 82.1 17.9 76.9 23.1 59.0 39.6 54.5 44.0<br />
Nkhata<br />
Bay<br />
96.8 28.6 62.7 35.7 77.0 24.6 73.8 24.6<br />
When statistics are compared, one observes that the numbers of those who can read are<br />
higher than those who can write. This may suggest that writing is a much more difficult<br />
skill than reading. It may also suggest that the adult literacy campaigns emphasise<br />
reading more than writing<br />
47