SOCIOLOLINGUISTIC SURVEYS - Centre for Language Studies
SOCIOLOLINGUISTIC SURVEYS - Centre for Language Studies
SOCIOLOLINGUISTIC SURVEYS - Centre for Language Studies

You also want an ePaper? Increase the reach of your titles
YUMPU automatically turns print PDFs into web optimized ePapers that Google loves.
pupils have Chichewa as an alternative to Chilomwe as a medium of instruction. The<br />
pupils’ responses indicate clearly that the learners have significant problems with<br />
studying in English. It is obvious from the findings that the pupils are more com<strong>for</strong>table<br />
with local languages as media of instruction than with English, a <strong>for</strong>eign tongue.<br />
The fact that pupils welcome the introduction of Chilomwe as a medium of instruction<br />
shows that there is now a growing positive attitude towards Lomwe. Matiki’s (1996/97)<br />
study on Chilomwe reports that it had 31.4% of the respondents claiming that they find it<br />
embarrasing to speak Chilomwe. The curent survey’s findings show that pupils display a<br />
positive attitude towards Chilomwe. The recent elevation of Chilomwe as one of the<br />
languages <strong>for</strong> newcasts on the national radio is one possible factor that could have<br />
instilled a sense of pride in the Lomwes. The new political dispensation in Malawi has<br />
created room <strong>for</strong> linguistic liberalisation, giving people the opportunity to freely promote<br />
their languages. This is in contrast to the one party state era during which vernacular<br />
languages were marginalised and despised.<br />
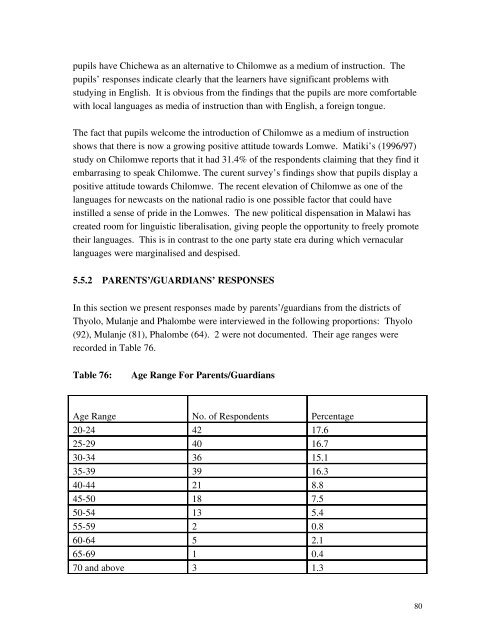
5.5.2 PARENTS’/GUARDIANS’ RESPONSES<br />
In this section we present responses made by parents’/guardians from the districts of<br />
Thyolo, Mulanje and Phalombe were interviewed in the following proportions: Thyolo<br />
(92), Mulanje (81), Phalombe (64). 2 were not documented. Their age ranges were<br />
recorded in Table 76.<br />
Table 76:<br />
Age Range For Parents/Guardians<br />
Age Range No. of Respondents Percentage<br />
2024 42 17.6<br />
2529 40 16.7<br />
3034 36 15.1<br />
3539 39 16.3<br />
4044 21 8.8<br />
4550 18 7.5<br />
5054 13 5.4<br />
5559 2 0.8<br />
6064 5 2.1<br />
6569 1 0.4<br />
70 and above 3 1.3<br />
80