SOCIOLOLINGUISTIC SURVEYS - Centre for Language Studies
SOCIOLOLINGUISTIC SURVEYS - Centre for Language Studies
SOCIOLOLINGUISTIC SURVEYS - Centre for Language Studies

Create successful ePaper yourself
Turn your PDF publications into a flip-book with our unique Google optimized e-Paper software.
Of the 817 subjects, 624 (76.4%) claimed that they speak Chisena; with 192 subjects<br />
(23.5%) saying that they were not speakers of the language; whilst 1 subject (0.1%) was<br />
undocumented.<br />
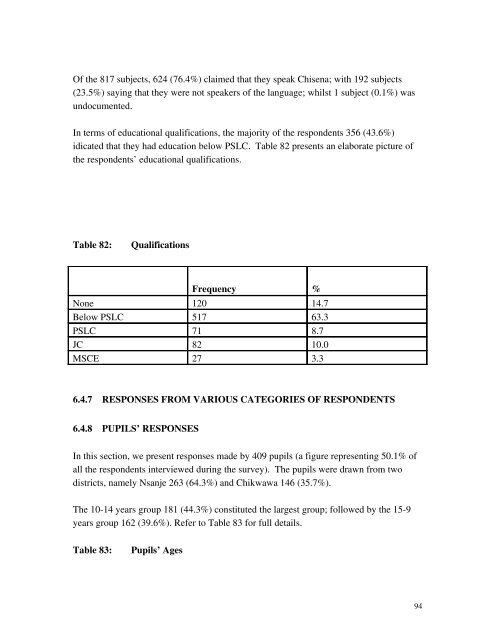
In terms of educational qualifications, the majority of the respondents 356 (43.6%)<br />
idicated that they had education below PSLC. Table 82 presents an elaborate picture of<br />
the respondents’ educational qualifications.<br />
Table 82:<br />
Qualifications<br />
Frequency %<br />
None 120 14.7<br />
Below PSLC 517 63.3<br />
PSLC 71 8.7<br />
JC 82 10.0<br />
MSCE 27 3.3<br />
6.4.7 RESPONSES FROM VARIOUS CATEGORIES OF RESPONDENTS<br />
6.4.8 PUPILS’ RESPONSES<br />
In this section, we present responses made by 409 pupils (a figure representing 50.1% of<br />
all the respondents interviewed during the survey). The pupils were drawn from two<br />
districts, namely Nsanje 263 (64.3%) and Chikwawa 146 (35.7%).<br />
The 1014 years group 181 (44.3%) constituted the largest group; followed by the 159<br />
years group 162 (39.6%). Refer to Table 83 <strong>for</strong> full details.<br />
Table 83:<br />
Pupils’ Ages<br />
94