SOCIOLOLINGUISTIC SURVEYS - Centre for Language Studies
SOCIOLOLINGUISTIC SURVEYS - Centre for Language Studies
SOCIOLOLINGUISTIC SURVEYS - Centre for Language Studies

You also want an ePaper? Increase the reach of your titles
YUMPU automatically turns print PDFs into web optimized ePapers that Google loves.
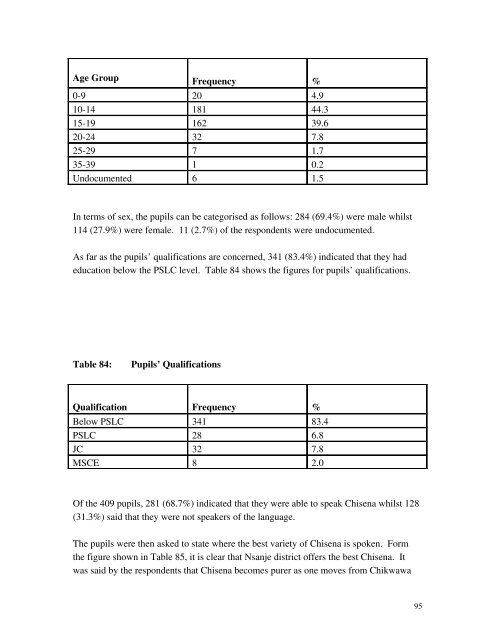
Age Group Frequency %<br />
09 20 4.9<br />
1014 181 44.3<br />
1519 162 39.6<br />
2024 32 7.8<br />
2529 7 1.7<br />
3539 1 0.2<br />
Undocumented 6 1.5<br />
In terms of sex, the pupils can be categorised as follows: 284 (69.4%) were male whilst<br />
114 (27.9%) were female. 11 (2.7%) of the respondents were undocumented.<br />
As far as the pupils’ qualifications are concerned, 341 (83.4%) indicated that they had<br />
education below the PSLC level. Table 84 shows the figures <strong>for</strong> pupils’ qualifications.<br />
Table 84:<br />
Pupils’ Qualifications<br />
Qualification Frequency %<br />
Below PSLC 341 83.4<br />
PSLC 28 6.8<br />
JC 32 7.8<br />
MSCE 8 2.0<br />
Of the 409 pupils, 281 (68.7%) indicated that they were able to speak Chisena whilst 128<br />
(31.3%) said that they were not speakers of the language.<br />
The pupils were then asked to state where the best variety of Chisena is spoken. Form<br />
the figure shown in Table 85, it is clear that Nsanje district offers the best Chisena. It<br />
was said by the respondents that Chisena becomes purer as one moves from Chikwawa<br />
95