SOCIOLOLINGUISTIC SURVEYS - Centre for Language Studies
SOCIOLOLINGUISTIC SURVEYS - Centre for Language Studies
SOCIOLOLINGUISTIC SURVEYS - Centre for Language Studies

Create successful ePaper yourself
Turn your PDF publications into a flip-book with our unique Google optimized e-Paper software.
Table 68 reveals that there is an interesting correlation between the parents/guardians<br />
liking their child to be taught in Chitumbuka and the age of the parents/guardians. Those<br />
between the 2024 (15.1%) recorded the highest liking followed by the 2529 (11.9%)<br />
age bracket, then 3034 (10.2%) and 3539(8.3%) respectively. It can be observed that<br />
generally as the age increases the number of parents/guardians wanting their chidren to<br />
be taught in Chitumbuka decreases. This observation can be explained by the fact that<br />
after 40 years, of age most people lead a settled life and tend to accept what has already<br />
established. Change is usually frowned upon hence they tend to accept the status quo. In<br />
this case, there<strong>for</strong>e, the introduction of Chitumbuka would create a lot of uncertanities<br />
which is deemed unnecessary.<br />
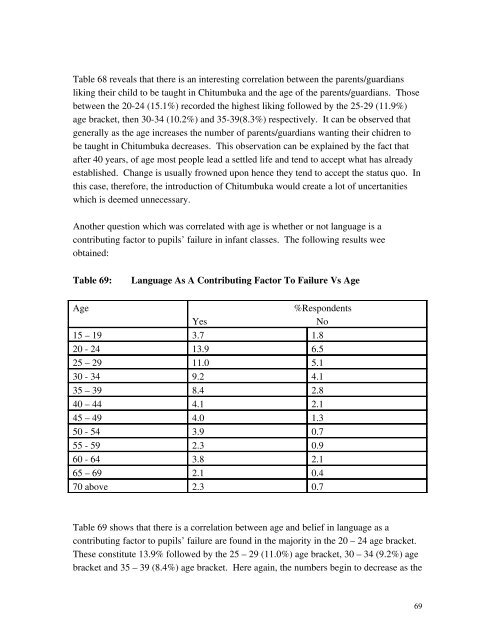
Another question which was correlated with age is whether or not language is a<br />
contributing factor to pupils’ failure in infant classes. The following results wee<br />
obtained:<br />
Table 69:<br />
<strong>Language</strong> As A Contributing Factor To Failure Vs Age<br />
Age %Respondents<br />
Yes<br />
No<br />
15 – 19 3.7 1.8<br />
20 24 13.9 6.5<br />
25 – 29 11.0 5.1<br />
30 34 9.2 4.1<br />
35 – 39 8.4 2.8<br />
40 – 44 4.1 2.1<br />
45 – 49 4.0 1.3<br />
50 54 3.9 0.7<br />
55 59 2.3 0.9<br />
60 64 3.8 2.1<br />
65 – 69 2.1 0.4<br />
70 above 2.3 0.7<br />
Table 69 shows that there is a correlation between age and belief in language as a<br />
contributing factor to pupils’ failure are found in the majority in the 20 – 24 age bracket.<br />
These constitute 13.9% followed by the 25 – 29 (11.0%) age bracket, 30 – 34 (9.2%) age<br />
bracket and 35 – 39 (8.4%) age bracket. Here again, the numbers begin to decrease as the<br />
69