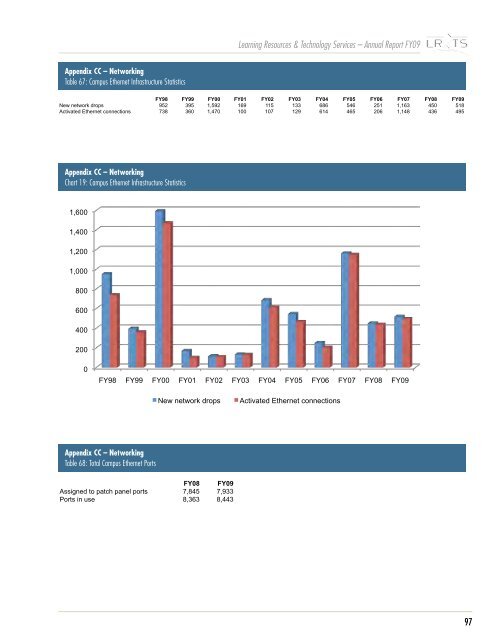
<strong>Learning</strong> <strong>Resources</strong> & Technology <strong>Services</strong> – <strong>Annual</strong> <strong>Report</strong> FY09 Appendix AB AB CC – Networking Networking Table 67: Campus Ethernet Infrastructure Statistics 65 - Campus Ethernet Infrastructure Statistics Table 65 - Campus Ethernet Infrastructure Statistics FY98 FY99 FY00 FY01 FY02 FY03 FY04 FY05 FY06 FY07 FY08 FY09 New network drops 952 395 1,592 169 1 1 5 133 686 546 251 1,163 450 518 FY98 FY99 FY00 FY01 FY02 FY03 FY04 FY05 FY Activated Ethernet connections 738 360 1,470 100 107 129 614 465 206 1,148 436 495 New network drops 952 395 1,592 169 11 5 133 686 546 2 Activated Appendix Ethernet AB connections 738 360 1,470 100 107 129 614 465 2 Networking Appendix AB Table 65 - Campus Ethernet Infrastructure Statistics Networking Chart 16 - Campus Ethernet Infrastructure Statistics FY98 FY99 FY00 FY01 FY02 FY03 FY04 FY05 FY06 FY Appendix New Appendix network AB CC drops – Networking 952 395 1592 169 11 5 133 686 546 251 1,1 1,600 Networking Activated Ethernet connections 738 360 1470 100 107 129 614 465 206 1,1 Chart 19: Campus Ethernet Infrastructure Statistics Chart 1,400 16 - Campus Ethernet Infrastructure Statistics 1,200 1,600 1,000 Appendix AB Networking 800 Chart 1,400 16 - Campus Ethernet Infrastructure Statistics 600 1,200 '%!!" 400 1,000 200 '$!!" 0 '#!!" 800 FY98 FY99 FY00 FY01 FY02 FY03 FY04 FY05 FY06 FY07 FY08 FY09 '!!!" 600 New network drops Activated Ethernet connections Appendix AB Networking 400 &!!" Table 66 - Total Campus Ethernet Ports %!!" 200 FY08 FY09 Assigned to patch panel ports 7,845 7,933 Ports in use $!!" 8,363 8,443 0 #!!" FY98 FY99 FY00 FY01 FY02 FY03 FY04 FY05 FY06 FY07 FY08 FY09 !" New network drops Activated Ethernet connections ()*&" ()**" ()!!" ()!'" ()!#" ()!+" ()!$" ()!," ()!%" ()!-" ()!&" ()!*" Appendix AB ./0"1/20345"64378" 9:;
<strong>Learning</strong> <strong>Resources</strong> & Technology <strong>Services</strong> – <strong>Annual</strong> <strong>Report</strong> FY09 Appendix AB Networking Appendix CC – Networking Table 69: 67 Network/System - Network/System Uptime Uptime Avg. Monthly ppendix AB Year Appendix AB Uptime Total Hours Total Downtime Hours Downtime etworking FY00 Networking 99.43% 8,760 50 4.17 Appendix AB able 67 - Network/System Table FY01 67 - Network/System Uptime 99.57% Uptime 8,760 38 3.17 Networking FY02 99.10% 8,760 78.84 6.57 Table 67 - Network/System Uptime FY03 99.18% 8,760 Avg. Monthly 71.42 Avg. Monthly 5.95 ear Year FY04Uptime Total Uptime Hours 99.80% Total Downtime Hours8,784 Total Hours Downtime Downtime 18.00 Hours Downtime 1.50 Y00 FY0099.43% 99.43% 8,760 8,760 50 50 4.17 Avg. Monthly 4.17 FY05 99.73% 8,760 23.67 1.97 Y01 FY01 Year 99.57% 99.57% Uptime 8,760 Total 8,760 Hours38 Total Downtime 38 3.17Hours Downtime 3.17 Y02 FY02 FY00 FY06 99.10% 99.10% 99.43% 8,760 99.90% 8,760 78.84 8,760 78.84506.57 9.00 6.574.17 0.75 Y03 FY03 FY01 FY0799.18% 99.18% 99.57% 8,760 99.93% 8,760 71.42 8,760 71.42385.95 6.00 5.953.17 0.50 Y04 FY04 FY02 FY0899.80% 99.80% 99.10% 8,784 99.94% 8,784 8,760 18.00 8,784 18.00 78.841.50 5.25 1.506.57 0.44 Y05 FY05 FY03 FY099.73% 99.73% 99.18% 8,760 99.93% 8,760 23.67 8,760 23.67 71.421.97 5.83 1.975.95 0.49 Y06 FY06 FY0499.90% 99.90% 99.80% 8,760 8,760 8,784 9.00 9.00 18.00.75 0.751.50 Y07 FY07 FY05 Appendix 99.93% 99.93% AB 99.73% 8,760 8,760 6.00 6.00 23.670.50 0.501.97 Y08 FY08 FY0699.94% 99.94% 99.90% 8,784 8,784 8,760 5.25 5.25 9.000.44 0.440.75 Y09 FY09 Networking FY0799.93% 99.93% 8,760 8,760 8,760 5.83 5.83 6.000.49 0.490.50 FY08 Table 68 - Reasons 99.94% for Network/System 8,784 Downtime 5.25 0.44 ppendix AB FY09 Appendix AB CC – Networking 99.93% 8,760 5.83 0.49 etworking Networking Hours Down able 68 - Reasons Downtime Table Table 70: Reasons for Network/System Downtime Appendix 68 for - AB Network/System Reasons for Network/System Downtime Downtime FY03 FY04 FY05 FY06 FY07 FY08 Maintenance Networking 4 12 4.17 2.00 2.00 2.50 Equipment/Technical Table 68 - Reasons for malfunction Network/System Downtime 67 Hours Down 4 Hours Down 18.50 4.00 3.00 1.75 owntime Reason Downtime Reason FY03 FY03 FY04 FY04 FY05 FY05 FY06 FY06 FY07 FY07 FY08 FY08 FY09 FY09 Security/Virus/Denial of service, etc. 0 2 1.00 3.00 1.00 1.00 aintenance Maintenance 4 4 12 4.17 12 4.17 2.00 2.00 2.00 2.50 2.50 2.50 To t a l 71 18.00 Hours 23.67 Down Equipment/Technical malfunction 67 4 18.50 4.00 9.00 3.00 1.75 6.00 3.335.25 quipment/Technical malfunction 67 4 18.50 4.00 3.00 1.75 3.33 Security/Virus/Denial Downtime Reason of service, etc. FY03 0 FY04 2 1.00 FY05 3.00 FY06 FY07 1.00 FY08 0.00 FY09 ecurity/Virus/Denial of service, etc. 0 2 1.00 3.00 1.00 1.00 0.00 o t a l To Maintenance t a l 71 7118.00 4 18.00 23.67 12 23.67 9.00 4.17 9.00 6.00 2.00 6.00 5.25 2.00 5.25 5.83 2.50 5.83 2.50 Equipment/Technical malfunction 67 4 18.50 4.00 3.00 1.75 3.33 Security/Virus/Denial of service, etc. 0 2 1.00 3.00 1.00 1.00 0.00 Appendix AB To t a l 71 18.00 23.67 9.00 6.00 5.25 5.83 Networking ppendix AB Appendix AB Table 69 - Number of Registered Campus Wireless Users etworking Networking able 69 - Number Table 69 of Registered - Number of Campus Registered Wireless Campus Users Wireless Users Appendix AB Networking Appendix CC – Networking % HuskyNet Total HuskyNet Table 71: 69 Number - Number % HuskyNet of Registered Number of Registered % Total Campus HuskyNet Accounts Wireless Campus Total Users Wireless HuskyNet Users Accouts FY00 Number Accounts Number 0 Accounts Accouts Accouts FY00 FY01 0 0 FY01 0 FY02 0% HuskyNet Total HuskyNet FY02 FY03 Number 0 85 Accounts Accouts FY03 FY00 850 FY04 552 3.04% 18,172 FY01 5520 3.04% 18,172 FY05 1,474 6.64% 22,202 FY02 1,474 0 6.64% 22,202 FY06 FY03 5,588 5,588 85 19.66% 19.66% 28,416 28,416 FY07 FY04 6,420 552 6,420 23.21% 3.04% 23.21% 27,658 18,172 27,658 FY08 FY05 7,153 1,474 7,153 26.83% 6.64% 26.83% 26,658 22,202 26,658 FY09 FY06 8,731 5,588 8,731 32.95% 19.66% 32.95% 26,497 28,416 26,497 FY07 6,420 23.21% 27,658 FY08 7,153 26.83% 26,658 FY09 8,731 32.95% 26,497 Y00 0 Y01 0 Y02 0 Y03 85 Y04 552 3.04% 18,172 Y05 1,474 6.64% 22,202 Y06 5,588 19.66% 28,416 Y07 6,420 23.21% 27,658 Y08 7,153 26.83% 26,658 Y09 8,731 32.95% 26,497 98