2008-2009 LR&TS Annual Report - Learning Resources Services ...
2008-2009 LR&TS Annual Report - Learning Resources Services ...
2008-2009 LR&TS Annual Report - Learning Resources Services ...

Create successful ePaper yourself
Turn your PDF publications into a flip-book with our unique Google optimized e-Paper software.
<strong>Learning</strong> <strong>Resources</strong> & Technology <strong>Services</strong> – <strong>Annual</strong> <strong>Report</strong> FY09<br />
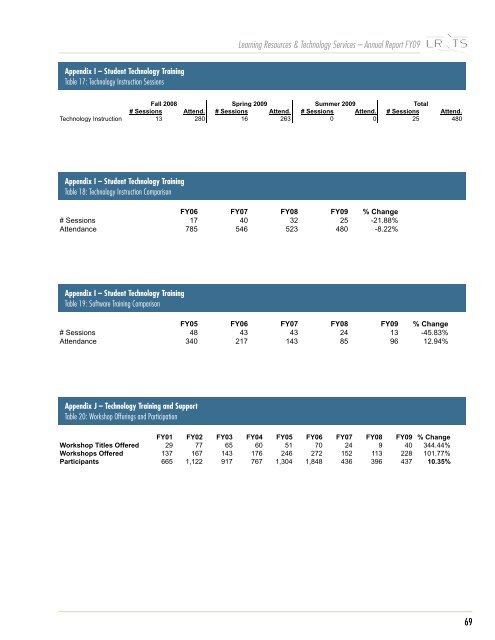
Appendix Appendix I I I – Student Technology Training<br />
Student Student<br />
Appendix Table Technology 17: Technology I<br />
Training Instruction TrainingSessions<br />
Table Table 17 - Technology 17 - Technology Instruction Instruction Sessions Sessions<br />
Student Technology Training<br />
Table 18 - Technology Instruction Fall <strong>2008</strong> Fall <strong>2008</strong> Comparison Spring Spring <strong>2009</strong> <strong>2009</strong><br />
Summer Summer <strong>2009</strong> <strong>2009</strong><br />
T o t a l T o t a l<br />
# Sessions # Sessions Attend. Attend. # Sessions # Sessions Attend. Attend. # Sessions # Sessions Attend. Attend. # Sessions # Sessions Attend. Attend.<br />
Technology Technology Instruction Instruction 13 13 FY06280 280 FY07 16 16 FY08263 0FY09 0 % Change 0 0 25 25 480 480<br />
# Sessions 17 40 32 25 -21.88%<br />
Attendance<br />
Appendix Appendix I I<br />
785 546 523 480 -8.22%<br />
Student Student Technology Technology Training Training<br />
Table Table 18 - Technology 18 - Technology Instruction Instruction Comparison Comparison<br />
Appendix I<br />
.<br />
Appendix Student Technology I<br />
Training FY06 FY06 FY07 FY07 FY08 FY08 FY09 FY09 % Change % Change<br />
# Sessions #<br />
Student Table Sessions Appendix 19 Technology - I – Software Student Technology Training 17 Training Sessions 17 Offered 40 40 32 32 25 25 -21.88% -21.88%<br />
Attendance Attendance 785 785 546 546 523 523 480 480 -8.22% -8.22%<br />
Table 18: 18 Technology - Technology Instruction Instruction Comparison Comparison<br />
Fall <strong>2008</strong> . . Spring <strong>2009</strong> To t a l<br />
Appendix Topic/Software Appendix I I<br />
# Sessions FY06 Attend. FY07 # Sessions FY08 Attend. FY09 #% Sessions Change Attend.<br />
Student # Dreamweaver Student Sessions Technology Technology Training Training<br />
17 6 40 90 32 0 25 0 -21.88% 6 90<br />
Table<br />
Attendance Flash Table 19 - Software 19 - Software Training Training Sessions Sessions Offered Offered 7851 5463 5230 4800 -8.22% 1 3<br />
Podcasting 4 1 0 0 4 1<br />
Web Design Theory Fall <strong>2008</strong> Fall <strong>2008</strong> 2 Spring 2Spring <strong>2009</strong> <strong>2009</strong> 0 T o t a l T<br />
.<br />
0o t a l 2 2<br />
Topic/Software # Sessions # Sessions Attend. Attend. # Sessions # Sessions Attend. Attend. # Sessions # Sessions Attend. Attend.<br />
Virtual<br />
Appendix<br />
Lab<br />
I<br />
0 0 0 0 0<br />
Dreamweaver 6 6 90 90 0 0 0 0 6 6 90 90<br />
Flash Flash To t a l 13 96 0 0 13 96<br />
Student Technology Training1 1 3 3 0 0 0 0 1 1 3 3<br />
Podcasting Podcasting 4 4 1 1 0 0 0 0 4 4 1 1<br />
Table 19 - Software Training Sessions Offered<br />
Web Design Web Design Theory Theory 2 2 2 2 0 0 0 0 2 2 2 2<br />
Virtual Virtual Appendix Lab Lab I<br />
0 0 0 0 0 0 0 0 0 0 0 0<br />
Appendix I – Student T o t a l T o t Technology a l 13Training<br />
Fall <strong>2008</strong>96 0 0 Spring 0 0<strong>2009</strong> 13 13 96 96To t a l<br />
Topic/Software<br />
Student Technology Training<br />
19: Software Training Comparison<br />
# Sessions Attend. # Sessions Attend. # Sessions Attend.<br />
Dreamweaver Table 20 - Software Training Comparison 6 90 0 0 6 90<br />
Appendix Flash Appendix I I<br />
1 3 0 0 1 3<br />
Student Podcasting Student Technology Technology Training Training FY05 4 FY06 1 FY07 0 FY08 0 FY09 4 % Change1<br />
Table<br />
Web # Table 20 Sessions - Software 20 - Software Training Training Comparison Comparison<br />
Design Theory 48 2 43 2 43 0 24 0 13 2 -45.83% 2<br />
Virtual Attendance Lab 3400 2170 1430 85 0 96 0 12.94%<br />
FY05 FY05 FY06 FY06 FY07 FY07 FY08 FY08 0<br />
To t a l 13 96 0 .<br />
FY09 FY09 % Change % Change<br />
# Sessions # Sessions 48 48 43 43 43 43 24 24 13 13 0 -45.83% -45.83% 13 96<br />
Attendance Attendance 340 340 217 217 143 143 85 85 96 96 12.94% 12.94%<br />
Appendix I<br />
Student Technology Training<br />
Table 20 - Software Training Comparison<br />
Appendix<br />
Appendix<br />
J<br />
– Technology Training and Support<br />
Technology Training and Support<br />
Table 20: Workshop Offerings and Participation FY05 FY06 FY07 FY08 FY09 % Change<br />
Table 22 - Workshop Offerings and Participation<br />
# Sessions 48 43 43 24 13 -45.83%<br />
Attendance 340 217 143 85 96 12.94%<br />
FY01 FY02 FY03 FY04 FY05 FY06 FY07 FY08 FY09 % Change<br />
Workshop Titles Offered 29 77 65 60 51<br />
.<br />
70 24 9 40 344.44%<br />
Workshops Offered 137 167 143 176 246 272 152 11 3 228 101.77%<br />
Participants 665 1,122 917 767 1,304 1,848 436 396 437 10.35%<br />
69