<strong>Learning</strong> <strong>Resources</strong> & Technology <strong>Services</strong> – <strong>Annual</strong> <strong>Report</strong> FY09 Appendix L Central Appendix Minnesota L – Central Libraries Minnesota Exchange Libraries (CMLE) Exchange (CMLE) Table Central Minnesota Libraries Exchange (CMLE) 24: 26 CMLE - CMLE Membership Membership Types Types Table 26 - CMLE Membership Types Ty p e Number K-12 Ty p e public Number 173 K-12 private public 173 32 Public K-12 private library branches in 2 regional systems 45 32 Post-secondary Public library branches institutions 2 regional systems 45 9 Special Post-secondary libraries institutions (law, hospital, correctional facilities, 9 historical Special libraries societies) (law, hospital, correctional facilities, 23 historical To t a l societies) 282 23 To t a l 282 Appendix L Appendix L – Central Minnesota Libraries Exchange (CMLE) Central Appendix Minnesota L Libraries Exchange (CMLE) Table Central Table 25: 27 Minnesota CMLE - CMLE Interlibrary Interlibrary Libraries Loan Statistics Exchange Loan Statistics (CMLE) Table 27 - CMLE Interlibrary Loan Statistics FY02 FY03 FY04 FY05 FY06 FY07 FY08 FY09 % Change Total requests received 8,580 FY02 8,649 FY03 7,697 FY04 7,245 FY05 7,175 FY06 6,107 FY07 4,723 FY08 3,838 FY09 %-18.74% Change Borrowing Total requests libraries received 8,580 129 8,649 104 7,697 101 7,245 84 7,175 79 6,107 75 4,723 62 3,838 58 -6.45% -18.74% Lending Borrowing sources libraries 11 129 5 104 98 101 64 72 84 12479 15775 13862 12858 -7.25% -6.45% Requests Lending sources filled 8,167 11 5 8,219 98 7,333 64 6,891 72 6,762 124 5,619 157 4,416 138 3,386 128 -23.32% -7.25% Requests unfilled/cancelled 8,167 413 8,219 430 7,333 367 6,891 354 6,762 413 5,619 488 4,416 307 3,386 465 51.47% -23.32% Requests unfilled/cancelled 413 430 367 354 413 488 307 465 51.47% Books 5,187 5,415 4,724 4,542 4,352 3,879 3,023 2,502 -17.23% Articles Books Appendix (photocopies) M 2,938 5,187 2,878 5,415 2,577 4,724 2,267 4,542 2,528 4,352 1,950 3,879 1,644 3,023 1,319 2,502 -19.77% -17.23% Articles Circulation (photocopies) 2,938 2,878 2,577 2,267 2,528 1,950 1,644 1,319 -19.77% Fill Rate 95.19% 95.03% 95.27% 95.11% 94.24% 92.01% 93.50% 88.22% Table 28 - Circulation Transactions Fill Rate 95.19% 95.03% 95.27% 95.11% 94.24% 92.01% 93.50% 88.22% FY02* FY03* FY04 FY05 FY06 FY07 FY08 FY09 % Appendix M Books Appendix checked M – Circulation out desk 73,060 81,848 58,010 34,760 36,814 40,159 41,073 45,401 Circulation ILL Table Table Books 28 26: Circulation checked - Circulation Transactions out at desk † † † † 790 3,219 4,064 4,885 Transactions Books checked out at self-check 6,750 9,574 765§ 8,408 7,759 7,119 7,944 9,774 Total books checked out FY02* 79,810FY03* 91,422 FY04 58,010 FY05 FY06 43,168 FY07 45,363 FY0850,497 FY09 % 53,081 Change 60,060 Books renewals checked out at desk 73,060 7,550 81,848 16,409 58,010 34,760 8,666 36,814 16,328 40,159 16,32041,073 5,795 45,401 8,993 10.54% 9,729 ILL Federal Books document checked checkouts at desk & uses † † † † 3,851 790 3,219 2,926 4,064 4,2544,885 3,618 20.20% 3,813 Books State document checked out checkouts at self-check & uses 6,750 9,574 765§ 8,408 7,759 554 7,119 559 7,944 11 3 9,774 23.04% 92 11 6 Total books items checked browsedout 79,81052,575 91,422 44,825 58,010 59,215 43,168 45,363 56,059 50,497 52,61653,08151,765 60,060 46,165 13.15% 58,445 Book New community renewals barcode applications 7,550 436 16,409 443 8,666 16,328 381 16,320 393 5,795 280 8,993 1849,729 8.18% 129 132 Federal document checkouts & uses 3,851 2,926 4,254 3,618 3,813 5.39% State document checkouts & uses 554 559 11 3 92 11 6 26.09% Total items browsed 52,575 44,825 59,215 56,059 52,616 51,765 46,165 58,445 26.60% * Some circulation activities were double-counted in PALS; double-counting was eliminated with the move to Aleph in FY04. New † ILL community books began barcode being applications checked out from 436 the Circulation 443 Desk in 381 March 2006. 393 This is 280 due to the 184 implementation 129 of the 132 Aleph ILL 2.33% module. § Due to migration to Aleph, the self-check machine was not operational July through mid-April of FY04. * Some circulation activities were double-counted in PALS; double-counting was eliminated with the move to Aleph in FY04. † ILL books began being checked out from the Circulation Desk in March 2006. This is due to the implementation of the Aleph ILL module. § Due to migration to Aleph, the self-check machine was not operational July through mid-April of FY04. Appendix M Appendix – Circulation Circulation Table Table 27: 29 Patron - Patron Records Records Appendix M Circulation Table 29 - Patron Records FY04* FY05 FY06 FY07 FY08 FY09 % Change Faculty/Staff 1,524 1,614 1,518 1,620 1,947 2,226 14.33% Retired Faculty/Staff 7 22 28 28 37 36 -2.70% FY04* FY05 FY06 FY07 FY08 FY09 % Change Undergraduate Students 12,534 19,149 19,431 17,835 19,438 20,315 4.51% Faculty/Staff 1,524 1,614 1,518 1,620 1,947 2,226 14.33% Retired Graduate Faculty/Staff Students 7 1,281 22 2,40428 2,970 28 2,255 37 36 2,801-2.70% 3,156 12.67% Undergraduate CMLE Students 12,534 223 19,149 19,431 226 17,835 244 19,438 243 20,315 252 4.51% 255 1.19% Graduate Community Students (active) 1,281 3812,404 849 2,970 2,255 786 2,801 544 3,156 50912.67% 459 -9.82% CMLE To t a l 22315,953 226 24,264244 24,977 243 22,525 252 255 24,984 1.19% 26,447 5.86% Interlibrary Loan 3 0 4 1 1 2 100.00% Community *Due to the (active) migration to Aleph, there were 381 some discrepancies 849 in 786 counts, particularly 544 for 509 students 459 and community -9.82% patrons. To t a l 15,953 24,264 24,981 22,526 24,985 26,449 5.86% *Due to the migration to Aleph, there were some discrepancies in counts, particularly for students and community patrons. 73
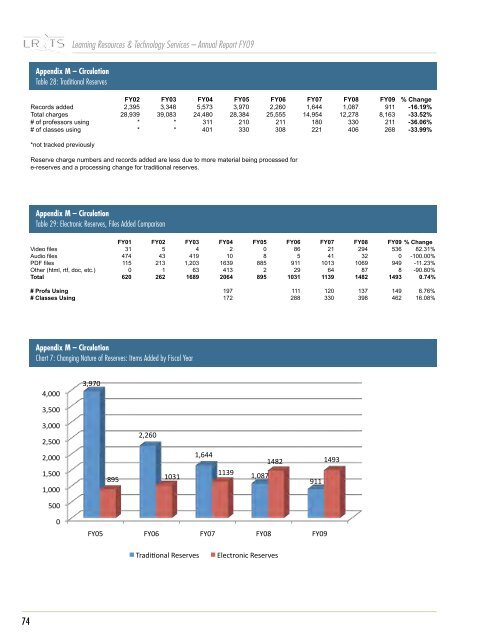
<strong>Learning</strong> <strong>Resources</strong> & Technology <strong>Services</strong> – <strong>Annual</strong> <strong>Report</strong> FY09 Appendix M Appendix M – Circulation Circulation Table Table 30 28: - Traditional Traditional Reserves Reserves Appendix M FY02 FY03 FY04 FY05 FY06 FY07 FY08 FY09 % Change Records Circulation added 2,395 3,348 5,573 3,970 2,260 1,644 1,087 9 11 -16.19% Total Table charges 30 - Traditional Reserves 28,939 39,083 24,480 28,384 25,555 14,954 12,278 8,163 -33.52% # of professors using * * 3 11 210 2 11 180 330 2 11 -36.06% # of classes using FY02 * FY03 * FY04 401 FY05 330 FY06 308FY07 221FY08 406 FY09 % Change 268 -33.99% Records added 2,395 3,348 5,573 3,970 2,260 1,644 1,087 9 1 1 -16.19% Total *not tracked chargespreviously # of professors using 28,939 * 39,083 * 24,480 3 1 1 28,384 210 25,555 2 1 1 14,954 180 12,278 330 8,163 2 1 1 -33.52% -36.06% # of classes using * * 401 330 308 221 Reserve charge numbers and records added are less due to more material being processed for e-reserves and a processing change for traditional reserves. *not tracked previously 406 268 -33.99% Reserve charge numbers and records added are less due 4 to more material being processed for e-reserves Appendix and M a processing change for traditional reserves. Circulation Table 31 - Electronic Reserves, Files Added 4Comparison Appendix M M – Circulation Circulation Table 29: Electronic Reserves, Files Added FY01Comparison FY02 FY03 FY04 FY05 FY06 FY07 FY08 FY09 % Change Video Table 31 files- Electronic Reserves, Files 31 Added Comparison 5 4 2 0 86 21 294 536 82.31% Audio files 474 43 419 10 8 5 41 32 0 -100.00% PDF files FY0111 5 FY02213 FY031,203 FY04 1639 FY05 885FY06 9 11 FY07 1013 FY08 1069 FY09 % Change 949 -11.23% Video files 31 5 4 2 0 86 21 294 536 82.31% Other (html, rtf, doc, etc.) 0 1 63 413 2 29 64 87 8 -90.80% Audio files 474 43 419 10 8 5 41 32 0 -100.00% To t a l 620 262 1689 2064 895 1031 1139 1482 1493 0.74% PDF files 1 1 5 213 1,203 1639 885 9 1 1 1013 1069 949 -11.23% Other (html, rtf, doc, etc.) 0 1 63 413 2 29 64 87 8 -90.80% T # o Profs t a l Using 620 262 1689 2064 197 895 1031 111 1139 120 1482 137 1493 0.74% 149 8.76% # Classes Using 172 288 330 398 462 16.08% # Profs Using 197 1 1 1 120 137 149 8.76% # Classes Using 172 288 330 398 462 16.08% Appendix M Circulation Appendix M – Circulation Chart Chart 77: - Changing Nature of Nature Reserves: of Items Reserves: Added by Fiscal Items Year added by FY (%!!!" '%.,!" '%#!!" '%!!!" &%#!!" &%&+!" &%!!!" $%#!!" $%!!!" -.#" $!'$" $%+((" $$'." $%!-," $(-&" .$$" $(.'" #!!" !" )*!#" )*!+" )*!," )*!-" )*!." /012345617"89:90;9:" 0563="89:90;9:" 74