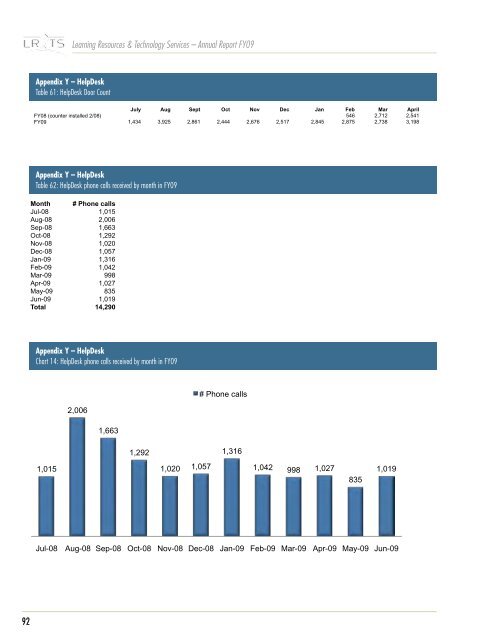
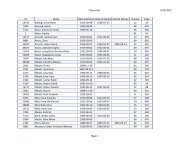
July Aug Sept Oct Nov Dec Jan Feb Mar <strong>Learning</strong> <strong>Resources</strong> & Technology <strong>Services</strong> – <strong>Annual</strong> <strong>Report</strong> FY09 Appendix W Appendix X – Electronic Classrooms/Audiovisual Support Electronic Classrooms/Audiovisual Support Table Table 58 59: - Equipment Equipment for All for Classrooms All Classrooms (includes e-classrooms) (includes E-Classrooms) Number of Classrooms with Item FY04 FY05 FY06 FY07 FY08 FY09 % Change LCD projectors 139 127 129 140 167 204 22.16% Computers 105 126 126 137 167 175 4.79% Televisions 159 144 147 147 147 147 0.00% VCRs 90 101 137 137 1 1 6 152 31.03% DVD players 35 55 89 89 1 1 6 152 31.03% Document projectors/ systems/cameras 66 100 1 1 0 121 152 188 23.68% SmartBoards 3 7 7 7 7 7 0.00% Cleaned up numbers FY09, master database of e-classrooms is held in LR<strong>TS</strong> dean's office Appendix Y – HelpDesk Table 60: HelpDesk Ticket Comparison Appendix Appendix Appendix X X HelpDesk HelpDesk HelpDesk Table Appendix 59 Table X Table - HelpDesk 59 59 - HelpDesk HelpDesk Ticket Comparison Ticket Ticket Comparison Comparison HelpDesk Semester Table Semester Semester 59 - HelpDesk Ticket Comparison FY00 FY00 FY00 FY01 FY01 FY01 FY02 FY02 FY02 FY03 FY03 FY03 FY04 FY04 FY04 FY05 FY05 FY05 FY06 FY06 FY06 FY07 FY07 FY07 FY08 FY08 FY08 FY09* FY09* FY09* Fall Fall Fall 2,543 2,543 2,543 3,296 3,296 3,296 3,879 3,879 3,879 6,436 6,436 6,436 7,633 7,633 7,633 4,442 4,442 4,442 4,998 4,998 4,998 4,528 4,528 4,528 3,082 3,082 3,082 3,265 3,265 3,265 Spring Spring 2,465 4,617 5,079 6,635 7,073 5,354 7,030 3,319 3,357 3,279 Semester Spring 2,465 2,465 4,617 FY00 4,617 5,079 FY01 5,079 6,635 FY02 6,635 7,073 FY037,073 5,354 FY04 5,354 7,030 FY057,030 3,319 FY06 3,319 3,357 FY07 3,357 3,279 3,279 FY08 Summer Summer (to 7/1)* 1,026 Fall Summer (to 7/1)* (to 7/1)* 1,026 2,543 3,296 3,879 6,436 7,633 4,442 4,998 4,528 1,026 3,082 Summer Summer (7/1 to Fall)* 973 Spring Summer (7/1 to Fall)* (7/1 to Fall)* 973 Total (Fall, Total Spring (Fall, only) Spring only) 5,008 5,008 2,465 7,913 7,913 4,617 8,958 8,958 13,071 5,079 13,071 14,706 6,63514,706 9,796 7,073 9,79612,028 5,354 12,0287,847 7,030 7,847 6,439 3,319 6,4396,544 6,544 3,357 973 Total (Fall, Spring only) 5,008 7,913 8,958 13,071 14,706 9,796 12,028 7,847 6,439 6,544 Summer (to 7/1)* Change Summer Change from Previous (7/1 from to Previous Fall)* Change from Previous Year Year Year (Fall, Total Spring (Fall, (Fall, (Fall, only) Spring Spring Spring only) only) only) 5,008 58.01% 58.01% 58.01% 13.21% 7,913 13.21% 13.21% 8,95845.91% 45.91% 12.51% 13,071 12.51% 12.51% -33.39% 14,706 -33.39% -33.39% 22.78% 9,796 22.78% 22.78% -34.76% 12,028 -34.76% -34.76% -17.94% -17.94% -17.94% 7,8471.63% 1.63% 1.63% 6,439 * FY09 Change marks * FY09 FY09 the from marks marks beginning Previous the the beginning beginning of a more Year of of thorough a more more thorough thorough reporting reporting reporting system which system system now which which provides now now provides provides statistics statistics statistics for tracking for for tracking tracking summer summer summer ticket counts. ticket ticket counts. counts. Summer (Fall, Summer Summer counts Spring are counts counts NOT only) are are figured NOT NOT into figured figured the above into into the the FY09 above above total FY09 FY09 and total total 58.01% previous and and previous previous year 13.21% percent year year percent percent change. 45.91% change. change. 12.51% -33.39% 22.78% -34.76% -17.94% Appendix Appendix * FY09 Appendix X marks X the beginning of a more thorough reporting system which now provides statistics for tracking summer ticket counts. HelpDesk HelpDesk Summer HelpDesk counts are NOT figured into the above FY09 total and previous year percent change. Chart 12 Chart Chart - HelpDesk 12 12 - HelpDesk HelpDesk Fall-Spring Fall-Spring Fall-Spring Ticket Comparison Ticket Ticket Comparison Comparison Appendix Appendix X Y – HelpDesk 5,008 5,008 5,008 HelpDesk 7,913 7,913 Chart 13: HelpDesk Ticket Comparison for 7,913 Fall and Spring semesters (&$!!!" Chart 12 (&$!!!" - HelpDesk Fall-Spring 8,958 Ticket 8,958 Comparison (%$*!&" (%$*!&" (&$!!!" 8,958 (%$*!&" 13,071 13,071 13,071 14,706 14,706 14,706 (,$!*(" 5,008 (,$!*(" (%$!!!" (%$!!!" (,$!*(" (%$!!!" 9,796 9,796 -.!!" -.!!" 9,796 7,913 (#$!#'" (#$!#'" -.!!" 12,028 12,028 (#$!#'" 12,028 (&$!!!" 7,847 8,958 (%$*!&" -.!(" -.!(" 7,847 -.!(" (#$!!!" (#$!!!" 7,847 (#$!!!" 6,439 6,439 13,071 +$*+&" +$*+&" -.!#" -.!#" 6,439 6,544 6,544 14,706 '$+)'" (,$!*(" +$*+&" -.!#" '$+)'" 6,544 -.!," (!$!!!" (%$!!!" (!$!!!" '$+)'" -.!," 9,796 -.!," -.!!" (!$!!!" *$+(," *$+(," (#$!#'" *$+(," 12,028 *$'%*" *$'%*" *$'%*" -.!%" -.!%" -.!%" -.!(" 7,847 '$!!!" (#$!!!" '$!!!" &$%,+" &$%,+" &$)%%" &$)%%" -.!)" -.!)" '$!!!" 6,439 &$%,+" &$)%%" -.!)" +$*+&" -.!#" -.!&" -.!&" )$!!'" )$!!'" 6,544 -.!&" '$+)'" -.!," &$!!!" (!$!!!" &$!!!" )$!!'" &$!!!" -.!*" -.!*" -.!*" *$+(," *$'%*" -.!'" -.!'" -.!%" -.!'" %$!!!" %$!!!" '$!!!" %$!!!" &$%,+" &$)%%"-.!+/" -.!+/" -.!)" -.!+/" -.!&" #$!!!" #$!!!" #$!!!" )$!!'" &$!!!" -.!*" !" !" !" %$!!!" #$!!!" Appendix Appendix Appendix X X HelpDesk HelpDesk HelpDesk Table 60 Table Table - HelpDesk 60 60 !" - HelpDesk HelpDesk Door Count Door Door Count Count July July July Aug Aug Aug Sept Sept Sept Oct Oct Oct Nov Nov Nov Dec Dec Dec Jan Jan Jan Feb Feb Feb Mar Mar Mar April April April May FY08 (counter FY08 FY08 (counter (counter installed installed installed 2/08) 2/08) 2/08) 546 546 546 2,712 2,712 2,712 2,541 2,541 2,541 2,717 FY09 FY09 FY09 1,434 1,434 1,434 3,925 3,925 3,925 2,861 2,861 2,861 2,444 2,444 2,444 2,676 2,676 2,676 2,517 2,517 2,517 2,845 2,845 2,845 2,875 2,875 2,875 2,738 2,738 2,738 3,198 3,198 3,198 1,801 Appendix X HelpDesk 91 Table 60 - HelpDesk Door Count -.!'" -.!+/"
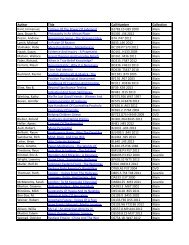
&$!!!" )$!!'" &$%,+" &$)%%" -.!&" -.!*" %$!!!" -.!'" -.!+" #$!!!" !" <strong>Learning</strong> <strong>Resources</strong> & Technology <strong>Services</strong> – <strong>Annual</strong> <strong>Report</strong> FY09 Appendix X Y – HelpDesk HelpDesk Table 61: HelpDesk Door Count Table 60 - HelpDesk Door Count July Aug Sept Oct Nov Dec Jan Feb Mar April May June T FY08 (counter installed 2/08) 546 2,712 2,541 2,717 1,491 10, FY09 1,434 3,925 2,861 2,444 2,676 2,517 2,845 2,875 2,738 3,198 1,801 1,976 31, Appendix Appendix Appendix ?? ?? Y – HelpDesk HelpDesk HelpDesk Calls Calls Table Table 62: ?? HelpDesk - ????? phone calls received by month in FY09 Table ?? - ????? Month Month # Phone # Phone calls calls Jul-08 Jul-08 1,015 1,015 Aug-08 Aug-08 2,006 2,006 Sep-08 Sep-08 1,663 1,663 Oct-08 Oct-08 1,292 1,292 Nov-08 Nov-08 1,020 1,020 Dec-08 Dec-08 1,057 1,057 Jan-09 Jan-09 1,316 1,316 Feb-09 Feb-09 1,042 1,042 Mar-09 Mar-09 998 998 Apr-09 Apr-09 1,027 1,027 May-09 May-09 835 835 Jun-09 Jun-09 1,019 1,019 To t a To l t a l 14,290 14,290 Appendix Y – HelpDesk Chart 14: HelpDesk phone calls received by month in FY09 # Phone # Phone calls calls 2,006 2,006 # Phone # Phone calls calls 1,663 1,663 1,015 1,015 1,292 1,292 1,316 1,316 1,020 1,057 1,020 1,057 1,042 1,042 998 1,027 998 1,027 835 835 1,019 1,019 Jul-08 Jul-08 Aug-08 Aug-08 Sep-08 Sep-08 Oct-08 Oct-08 Nov-08 Nov-08 Dec-08 Dec-08 Jan-09 Jan-09 Feb-09 Feb-09 Mar-09 Mar-09 Apr-09 Apr-09 May-09 May-09 Jun-09 Jun-09 92