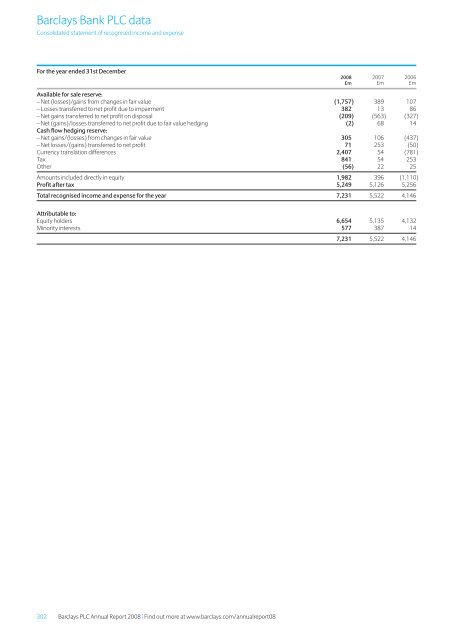
<strong>Barclays</strong> Bank PLC data Consolidated statement of recognised income and expense For the year ended 31st December <strong>2008</strong> 2007 2006 £m £m £m Available for sale reserve: – Net (losses)/gains from changes in fair value (1,757) 389 107 – Losses transferred to net profit due to impairment 382 13 86 – Net gains transferred to net profit on disposal (209) (563) (327) – Net (gains)/losses transferred to net profit due to fair value hedging (2) 68 14 Cash flow hedging reserve: – Net gains/(losses) from changes in fair value 305 106 (437) – Net losses/(gains) transferred to net profit 71 253 (50) Currency translation differences 2,407 54 (781) Tax 841 54 253 Other (56) 22 25 Amounts included directly in equity 1,982 396 (1,110) Profit after tax 5,249 5,126 5,256 Total recognised income and expense for the year 7,231 5,522 4,146 Attributable to: Equity holders 6,654 5,135 4,132 Minority interests 577 387 14 7,231 5,522 4,146 302 <strong>Barclays</strong> PLC <strong>Annual</strong> <strong>Report</strong> <strong>2008</strong> | Find out more at www.barclays.com/annualreport08
<strong>Barclays</strong> Bank PLC data Consolidated cash flow statement For the year ended 31st December <strong>2008</strong> 2007 2006 £m £m £m Reconciliation of profit before tax to net cash flows from operating activities: Profit before tax 6,035 7,107 7,197 Adjustment for non-cash items: Allowance for impairment 5,419 2,795 2,154 Depreciation and amortisation and impairment of property, plant, equipment and intangibles 951 669 612 Other provisions, including pensions 804 753 558 Net profit from associates and joint ventures (14) (42) (46) Net profit on disposal of investments and property, plant and equipment (371) (862) (778) Net profit from disposal of associates and joint ventures – (26) (263) Net profit from disposal of subsidiaries (327) (2) (60) Net gains on acquisitions (2,406) – – Other non-cash movements 830 (1,471) 1,661 Changes in operating assets and liabilities: Net increase in loans and advances to banks and customers (58,432) (77,987) (27,385) Net increase in deposits and debt securities in issue 76,886 91,451 46,944 Net (increase)/decrease in derivative financial instruments (17,529) (2,144) 1,196 Net decrease/(increase) in trading portfolio assets 26,945 (18,245) (18,333) Net (decrease)/increase in trading liabilities (5,928) (6,472) 310 Net decrease/(increase) in financial investments 5,229 (4,379) 1,538 Net (increase)/decrease in other assets (3,005) 1,296 (1,527) Net decrease in other liabilities (492) (1,056) (1,580) Tax paid (1,725) (1,583) (2,141) Net cash from operating activities 32,870 (10,198) 10,057 Purchase of available for sale financial investments (57,756) (26,947) (47,109) Proceeds from sale or redemption of available for sale financial investments 51,429 38,423 46,069 Purchase of intangible assets (687) (263) (212) Purchase of property, plant and equipment (1,720) (1,241) (654) Proceeds from sale of property, plant and equipment 799 617 786 Acquisition of subsidiaries, net of cash acquired (961) (270) (248) Disposal of subsidiaries, net of cash disposed 238 383 (15) Increase in investment in subsidiaries (157) (668) (432) Decrease in investment in subsidiaries 19 57 44 Acquisition of associates and joint ventures (96) (220) (162) Disposal of associates and joint ventures 137 145 739 Other cash flows associated with investing activities – – 17 Net cash from investing activities (8,755) 10,016 (1,177) Dividends paid (1,796) (3,418) (2,373) Proceeds from borrowings and issuance of debt securities 9,645 4,625 2,493 Repayments of borrowings and redemption of debt securities (1,207) (683) (366) Net issue of shares and other equity instruments 1,327 1,355 585 Capital injection from <strong>Barclays</strong> PLC 5,137 1,434 – Net issues of shares to minority interests 11 199 226 Net cash from financing activities 13,117 3,512 565 Effect of exchange rates on cash and cash equivalents (5,801) (654) 552 Net increase in cash and cash equivalents 31,431 2,676 9,997 Cash and cash equivalents at beginning of year 33,078 30,402 20,405 Cash and cash equivalents at end of year 64,509 33,078 30,402 Cash and cash equivalents comprise: Cash and balances at central banks 30,019 5,801 6,795 Loans and advances to banks 47,707 40,120 30,926 Less: non-cash amounts and amounts with original maturity greater than three months (15,428) (19,376) (15,892) 32,279 20,744 15,034 Available for sale treasury and other eligible bills 65,016 43,256 51,952 Less: non-cash and amounts with original maturity greater than three months (62,916) (41,872) (50,933) 2,100 1,384 1,019 Trading portfolio assets 185,646 193,726 177,884 Less: non-cash and amounts with maturity greater than three months (185,535) (188,591) (170,346) 111 5,135 7,538 Other – 14 16 64,509 33,078 30,402 3 <strong>Financial</strong> <strong>statements</strong> <strong>Barclays</strong> PLC <strong>Annual</strong> <strong>Report</strong> <strong>2008</strong> 303