Barclays plc - Annual Report 2008 - Financial statements - The Group
Barclays plc - Annual Report 2008 - Financial statements - The Group
Barclays plc - Annual Report 2008 - Financial statements - The Group

You also want an ePaper? Increase the reach of your titles
YUMPU automatically turns print PDFs into web optimized ePapers that Google loves.
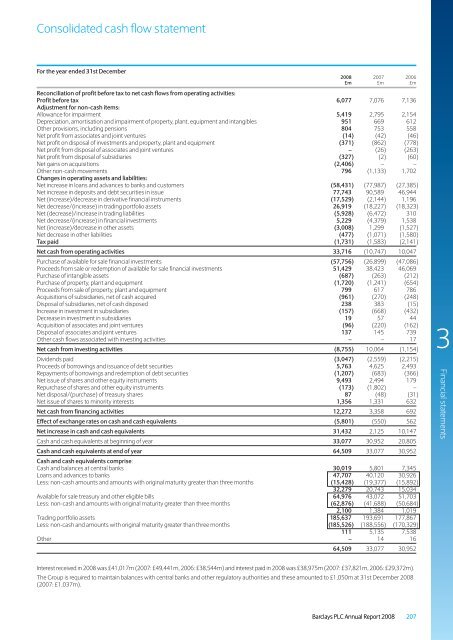
Consolidated cash flow statement<br />
For the year ended 31st December<br />
<strong>2008</strong> 2007 2006<br />
£m £m £m<br />
Reconciliation of profit before tax to net cash flows from operating activities:<br />
Profit before tax 6,077 7,076 7,136<br />
Adjustment for non-cash items:<br />
Allowance for impairment 5,419 2,795 2,154<br />
Depreciation, amortisation and impairment of property, plant, equipment and intangibles 951 669 612<br />
Other provisions, including pensions 804 753 558<br />
Net profit from associates and joint ventures (14) (42) (46)<br />
Net profit on disposal of investments and property, plant and equipment (371) (862) (778)<br />
Net profit from disposal of associates and joint ventures – (26) (263)<br />
Net profit from disposal of subsidiaries (327) (2) (60)<br />
Net gains on acquisitions (2,406) – –<br />
Other non-cash movements 796 (1,133) 1,702<br />
Changes in operating assets and liabilities:<br />
Net increase in loans and advances to banks and customers (58,431) (77,987) (27,385)<br />
Net increase in deposits and debt securities in issue 77,743 90,589 46,944<br />
Net (increase)/decrease in derivative financial instruments (17,529) (2,144) 1,196<br />
Net decrease/(increase) in trading portfolio assets 26,919 (18,227) (18,323)<br />
Net (decrease)/increase in trading liabilities (5,928) (6,472) 310<br />
Net decrease/(increase) in financial investments 5,229 (4,379) 1,538<br />
Net (increase)/decrease in other assets (3,008) 1,299 (1,527)<br />
Net decrease in other liabilities (477) (1,071) (1,580)<br />
Tax paid (1,731) (1,583) (2,141)<br />
Net cash from operating activities 33,716 (10,747) 10,047<br />
Purchase of available for sale financial investments (57,756) (26,899) (47,086)<br />
Proceeds from sale or redemption of available for sale financial investments 51,429 38,423 46,069<br />
Purchase of intangible assets (687) (263) (212)<br />
Purchase of property, plant and equipment (1,720) (1,241) (654)<br />
Proceeds from sale of property, plant and equipment 799 617 786<br />
Acquisitions of subsidiaries, net of cash acquired (961) (270) (248)<br />
Disposal of subsidiaries, net of cash disposed 238 383 (15)<br />
Increase in investment in subsidiaries (157) (668) (432)<br />
Decrease in investment in subsidiaries 19 57 44<br />
Acquisition of associates and joint ventures (96) (220) (162)<br />
Disposal of associates and joint ventures 137 145 739<br />
Other cash flows associated with investing activities – – 17<br />
Net cash from investing activities (8,755) 10,064 (1,154)<br />
Dividends paid (3,047) (2,559) (2,215)<br />
Proceeds of borrowings and issuance of debt securities 5,763 4,625 2,493<br />
Repayments of borrowings and redemption of debt securities (1,207) (683) (366)<br />
Net issue of shares and other equity instruments 9,493 2,494 179<br />
Repurchase of shares and other equity instruments (173) (1,802) –<br />
Net disposal/(purchase) of treasury shares 87 (48) (31)<br />
Net issue of shares to minority interests 1,356 1,331 632<br />
Net cash from financing activities 12,272 3,358 692<br />
Effect of exchange rates on cash and cash equivalents (5,801) (550) 562<br />
Net increase in cash and cash equivalents 31,432 2,125 10,147<br />
Cash and cash equivalents at beginning of year 33,077 30,952 20,805<br />
Cash and cash equivalents at end of year 64,509 33,077 30,952<br />
Cash and cash equivalents comprise:<br />
Cash and balances at central banks 30,019 5,801 7,345<br />
Loans and advances to banks 47,707 40,120 30,926<br />
Less: non-cash amounts and amounts with original maturity greater than three months (15,428) (19,377) (15,892)<br />
32,279 20,743 15,034<br />
Available for sale treasury and other eligible bills 64,976 43,072 51,703<br />
Less: non-cash and amounts with original maturity greater than three months (62,876) (41,688) (50,684)<br />
2,100 1,384 1,019<br />
Trading portfolio assets 185,637 193,691 177,867<br />
Less: non-cash and amounts with original maturity greater than three months (185,526) (188,556) (170,329)<br />
111 5,135 7,538<br />
Other – 14 16<br />
64,509 33,077 30,952<br />
3<br />
<strong>Financial</strong> <strong>statements</strong><br />
Interest received in <strong>2008</strong> was £41,017m (2007: £49,441m, 2006: £38,544m) and interest paid in <strong>2008</strong> was £38,975m (2007: £37,821m, 2006: £29,372m).<br />
<strong>The</strong> <strong>Group</strong> is required to maintain balances with central banks and other regulatory authorities and these amounted to £1,050m at 31st December <strong>2008</strong><br />
(2007: £1,037m).<br />
<strong>Barclays</strong> PLC <strong>Annual</strong> <strong>Report</strong> <strong>2008</strong> 207