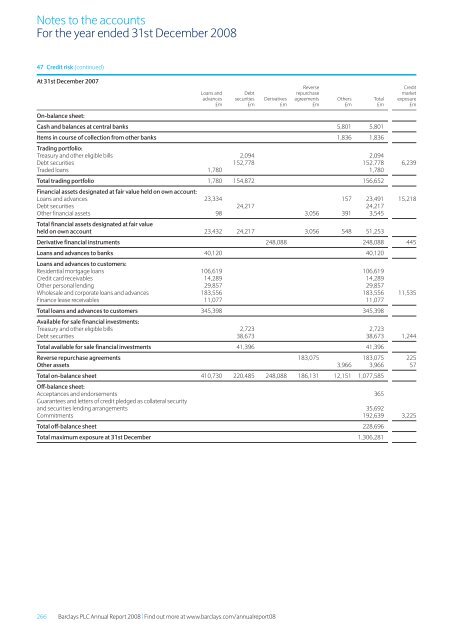
Notes to the accounts For the year ended 31st December <strong>2008</strong> 47 Credit risk (continued) At 31st December 2007 Reverse Credit Loans and Debt repurchase market advances securities Derivatives agreements Others Total exposure £m £m £m £m £m £m £m On-balance sheet: Cash and balances at central banks 5,801 5,801 Items in course of collection from other banks 1,836 1,836 Trading portfolio: Treasury and other eligible bills 2,094 2,094 Debt securities 152,778 152,778 6,239 Traded loans 1,780 1,780 Total trading portfolio 1,780 154,872 156,652 <strong>Financial</strong> assets designated at fair value held on own account: Loans and advances 23,334 157 23,491 15,218 Debt securities 24,217 24,217 Other financial assets 98 3,056 391 3,545 Total financial assets designated at fair value held on own account 23,432 24,217 3,056 548 51,253 Derivative financial instruments 248,088 248,088 445 Loans and advances to banks 40,120 40,120 Loans and advances to customers: Residential mortgage loans 106,619 106,619 Credit card receivables 14,289 14,289 Other personal lending 29,857 29,857 Wholesale and corporate loans and advances 183,556 183,556 11,535 Finance lease receivables 11,077 11,077 Total loans and advances to customers 345,398 345,398 Available for sale financial investments: Treasury and other eligible bills 2,723 2,723 Debt securities 38,673 38,673 1,244 Total available for sale financial investments 41,396 41,396 Reverse repurchase agreements 183,075 183,075 225 Other assets 3,966 3,966 57 Total on-balance sheet 410,730 220,485 248,088 186,131 12,151 1,077,585 Off-balance sheet: Acceptances and endorsements 365 Guarantees and letters of credit pledged as collateral security and securities lending arrangements 35,692 Commitments 192,639 3,225 Total off-balance sheet 228,696 Total maximum exposure at 31st December 1,306,281 266 <strong>Barclays</strong> PLC <strong>Annual</strong> <strong>Report</strong> <strong>2008</strong> | Find out more at www.barclays.com/annualreport08
47 Credit risk (continued) Credit risk concentrations A concentration of credit risk exists when a number of counterparties are engaged in similar activities and have similar economic characteristics that would cause their ability to meet contractual obligations to be similarly affected by changes in economic or other conditions. <strong>The</strong> analyses of credit risk concentrations presented below are based on the location of the counterparty or customer or the industry in which they are engaged. Credit risk concentrations by geographical sector <strong>2008</strong> Other Rest of United European United the Kingdom Union States Africa World Total £m £m £m £m £m £m On-balance sheet: Cash and balances at central banks 8,406 11,039 8,381 1,712 481 30,019 Items in the course of collection from other banks 1,447 59 – 169 20 1,695 Trading portfolio 23,865 35,396 66,084 2,770 26,185 154,300 <strong>Financial</strong> assets designated at fair value held on own account 14,158 7,388 19,738 2,904 3,858 48,046 Derivative financial instruments 317,621 215,054 366,161 4,403 81,563 984,802 Loans and advances to banks 7,524 12,591 13,616 2,189 11,787 47,707 Loans and advances to customers 213,079 91,109 75,826 44,373 37,428 461,815 Available for sale financial investments 15,423 18,928 16,583 3,351 8,549 62,834 Reverse repurchase agreements 22,659 41,724 47,034 848 18,089 130,354 Other assets 1,198 548 550 520 280 3,096 Total on-balance sheet 625,380 433,836 613,973 63,239 188,240 1,924,668 Off-balance sheet: Acceptances and endorsements 274 – 6 41 264 585 Guarantees and letters of credit pledged as collateral security and securities lending arrangements 4,433 3,742 42,227 1,738 1,802 53,942 Commitments 103,548 32,445 90,298 23,210 11,315 260,816 Total off-balance sheet 108,255 36,187 132,531 24,989 13,381 315,343 Total 733,635 470,023 746,504 88,228 201,621 2,240,011 Credit risk concentrations by geographical sector 2007 Other Rest of United European United the Kingdom Union States Africa World Total £m £m £m £m £m £m On-balance sheet: Cash and balances at central banks 1,458 2,170 206 1,406 561 5,801 Items in the course of collection from other banks 1,638 75 – 110 13 1,836 Trading portfolio 28,959 41,675 53,208 877 31,933 156,652 <strong>Financial</strong> assets designated at fair value held on own account 15,713 5,907 20,396 958 8,279 51,253 Derivative financial instruments 60,534 75,017 82,975 2,229 27,333 248,088 Loans and advances to banks 5,515 11,102 13,443 2,581 7,479 40,120 Loans and advances to customers 187,824 56,189 39,944 38,653 22,788 345,398 Available for sale financial investments 5,934 18,354 7,818 2,944 6,346 41,396 Reverse repurchase agreements 42,160 51,734 67,018 2,156 20,007 183,075 Other assets 1,813 617 424 698 414 3,966 Total on-balance sheet 351,548 262,840 285,432 52,612 125,153 1,077,585 3 <strong>Financial</strong> <strong>statements</strong> Off-balance sheet: Acceptances and endorsements 227 5 5 34 94 365 Guarantees and letters of credit pledged as collateral security and securities lending arrangements 7,377 1,468 23,696 1,286 1,865 35,692 Commitments 90,964 23,946 48,657 20,471 8,601 192,639 Total off-balance sheet 98,568 25,419 72,358 21,791 10,560 228,696 Total 450,116 288,259 357,790 74,403 135,713 1,306,281 <strong>Barclays</strong> PLC <strong>Annual</strong> <strong>Report</strong> <strong>2008</strong> 267