Barclays plc - Annual Report 2008 - Financial statements - The Group
Barclays plc - Annual Report 2008 - Financial statements - The Group
Barclays plc - Annual Report 2008 - Financial statements - The Group
Create successful ePaper yourself
Turn your PDF publications into a flip-book with our unique Google optimized e-Paper software.
Notes to the accounts<br />
For the year ended 31st December <strong>2008</strong><br />
48 Market risk (continued)<br />
Non-trading interest rate risk<br />
Non-traded interest rate risk arises from the provision of retail and wholesale (non-traded) banking products and services.<br />
<strong>Barclays</strong> objective is to minimise non-traded risk. This is achieved by transferring risk from the business to a local treasury or <strong>Group</strong> Treasury, who in turn<br />
hedge the net exposure with the external market. Limits exist to ensure no material risk is retained within any business or product area. <strong>The</strong> majority of<br />
exposures are within Global Retail and Commercial Banking .<br />
Risk measurement and control<br />
<strong>The</strong> techniques used to measure and control non-traded interest rate risk include <strong>Annual</strong> Earnings at Risk, DVaR and Stress Testing. Book limits such as<br />
foreign exchange and interest position limits are also in place.<br />
<strong>Annual</strong> Earnings at Risk (AEaR) measures the sensitivity of net interest income (NII) over the next 12 months. It is calculated as the difference between<br />
the estimated income using the current yield curve and the lowest estimated income following a 100 basis points increase or decrease in interest rates.<br />
DVaR is also used as a complementary tool to AEaR.<br />
Stress testing is also carried out by the business centres and is reviewed by senior management and business-level asset and liability committees. <strong>The</strong><br />
stress testing is tailored to the business and typically incorporates scenario analysis and historical stress movements applied to respective portfolios.<br />
Analysis of Net Interest Income sensitivity<br />
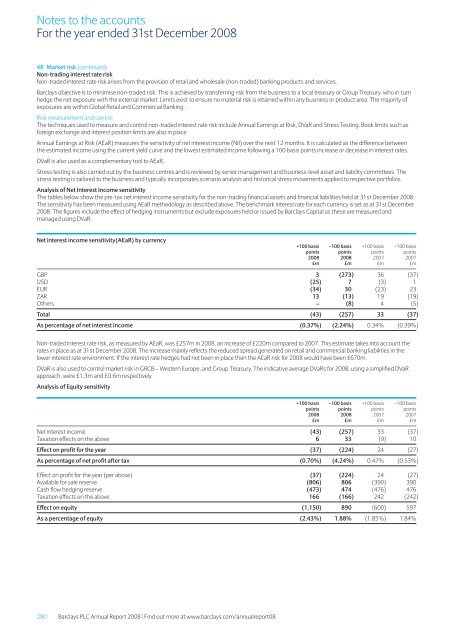
<strong>The</strong> tables below show the pre-tax net interest income sensitivity for the non-trading financial assets and financial liabilities held at 31st December <strong>2008</strong>.<br />
<strong>The</strong> sensitivity has been measured using AEaR methodology as described above. <strong>The</strong> benchmark interest rate for each currency is set as at 31st December<br />
<strong>2008</strong>. <strong>The</strong> figures include the effect of hedging instruments but exclude exposures held or issued by <strong>Barclays</strong> Capital as these are measured and<br />
managed using DVaR.<br />
Net interest income sensitivity(AEaR) by currency<br />
+100 basis –100 basis +100 basis –100 basis<br />
points points points points<br />
<strong>2008</strong> <strong>2008</strong> 2007 2007<br />
£m £m £m £m<br />
GBP 3 (273) 36 (37)<br />
USD (25) 7 (3) 1<br />
EUR (34) 30 (23) 23<br />
ZAR 13 (13) 19 (19)<br />
Others – (8) 4 (5)<br />
Total (43) (257) 33 (37)<br />
As percentage of net interest income (0.37%) (2.24%) 0.34% (0.39%)<br />
Non-traded interest rate risk, as measured by AEaR, was £257m in <strong>2008</strong>, an increase of £220m compared to 2007. This estimate takes into account the<br />
rates in place as at 31st December <strong>2008</strong>. <strong>The</strong> increase mainly reflects the reduced spread generated on retail and commercial banking liabilities in the<br />
lower interest rate environment. If the interest rate hedges had not been in place then the AEaR risk for <strong>2008</strong> would have been £670m.<br />
DVaR is also used to control market risk in GRCB – Western Europe, and <strong>Group</strong> Treasury. <strong>The</strong> indicative average DVaRs for <strong>2008</strong>, using a simplified DVaR<br />
approach, were £1.3m and £0.6m respectively.<br />
Analysis of Equity sensitivity<br />
+100 basis –100 basis +100 basis –100 basis<br />
points points points points<br />
<strong>2008</strong> <strong>2008</strong> 2007 2007<br />
£m £m £m £m<br />
Net interest income (43) (257) 33 (37)<br />
Taxation effects on the above 6 33 (9) 10<br />
Effect on profit for the year (37) (224) 24 (27)<br />
As percentage of net profit after tax (0.70%) (4.24%) 0.47% (0.53%)<br />
Effect on profit for the year (per above) (37) (224) 24 (27)<br />
Available for sale reserve (806) 806 (390) 390<br />
Cash flow hedging reserve (473) 474 (476) 476<br />
Taxation effects on the above 166 (166) 242 (242)<br />
Effect on equity (1,150) 890 (600) 597<br />
As a percentage of equity (2.43%) 1.88% (1.85%) 1.84%<br />
280 <strong>Barclays</strong> PLC <strong>Annual</strong> <strong>Report</strong> <strong>2008</strong> | Find out more at www.barclays.com/annualreport08


