Open Core Protocol Debug Interface Specification rev 1.0 - OCP-IP
Open Core Protocol Debug Interface Specification rev 1.0 - OCP-IP
Open Core Protocol Debug Interface Specification rev 1.0 - OCP-IP
Create successful ePaper yourself
Turn your PDF publications into a flip-book with our unique Google optimized e-Paper software.
<strong>OCP</strong>-<strong>IP</strong> Confidential<br />
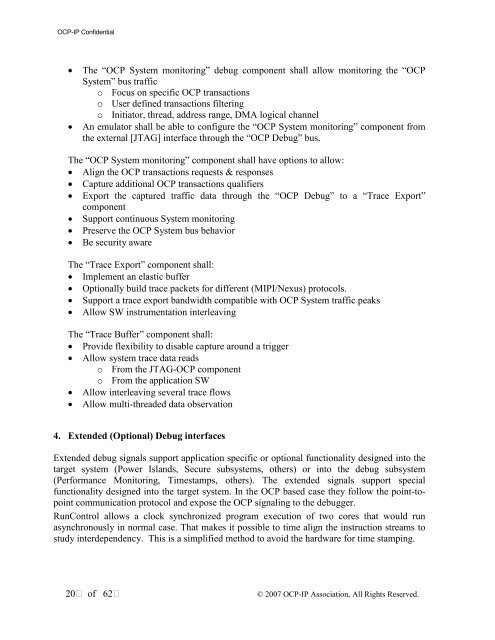
• The “<strong>OCP</strong> System monitoring” debug component shall allow monitoring the “<strong>OCP</strong><br />
System” bus traffic<br />
o Focus on specific <strong>OCP</strong> transactions<br />
o User defined transactions filtering<br />
o Initiator, thread, address range, DMA logical channel<br />
• An emulator shall be able to configure the “<strong>OCP</strong> System monitoring” component from<br />
the external [JTAG] interface through the “<strong>OCP</strong> <strong>Debug</strong>” bus.<br />
The “<strong>OCP</strong> System monitoring” component shall have options to allow:<br />
• Align the <strong>OCP</strong> transactions requests & responses<br />
• Capture additional <strong>OCP</strong> transactions qualifiers<br />
• Export the captured traffic data through the “<strong>OCP</strong> <strong>Debug</strong>” to a “Trace Export”<br />
component<br />
• Support continuous System monitoring<br />
• Preserve the <strong>OCP</strong> System bus behavior<br />
• Be security aware<br />
The “Trace Export” component shall:<br />
• Implement an elastic buffer<br />
• Optionally build trace packets for different (M<strong>IP</strong>I/Nexus) protocols.<br />
• Support a trace export bandwidth compatible with <strong>OCP</strong> System traffic peaks<br />
• Allow SW instrumentation interleaving<br />
The “Trace Buffer” component shall:<br />
• Provide flexibility to disable capture around a trigger<br />
• Allow system trace data reads<br />
o From the JTAG-<strong>OCP</strong> component<br />
o From the application SW<br />
• Allow interleaving several trace flows<br />
• Allow multi-threaded data observation<br />
4. Extended (Optional) <strong>Debug</strong> interfaces<br />
Extended debug signals support application specific or optional functionality designed into the<br />
target system (Power Islands, Secure subsystems, others) or into the debug subsystem<br />
(Performance Monitoring, Timestamps, others). The extended signals support special<br />
functionality designed into the target system. In the <strong>OCP</strong> based case they follow the point-topoint<br />
communication protocol and expose the <strong>OCP</strong> signaling to the debugger.<br />
RunControl allows a clock synchronized program execution of two cores that would run<br />
asynchronously in normal case. That makes it possible to time align the instruction streams to<br />
study interdependency. This is a simplified method to avoid the hardware for time stamping.<br />
20 of 62<br />
© 2007 <strong>OCP</strong>-<strong>IP</strong> Association, All Rights Reserved.


