Open Core Protocol Debug Interface Specification rev 1.0 - OCP-IP
Open Core Protocol Debug Interface Specification rev 1.0 - OCP-IP
Open Core Protocol Debug Interface Specification rev 1.0 - OCP-IP

Create successful ePaper yourself
Turn your PDF publications into a flip-book with our unique Google optimized e-Paper software.
<strong>OCP</strong>-<strong>IP</strong> Confidential<br />
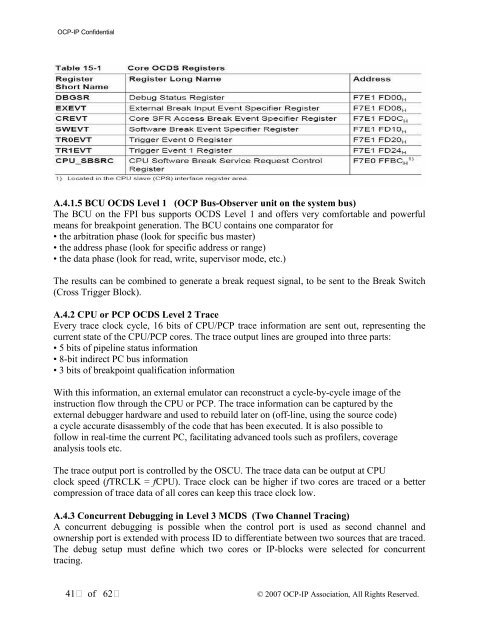
A.4.1.5 BCU OCDS Level 1 (<strong>OCP</strong> Bus-Observer unit on the system bus)<br />
The BCU on the FPI bus supports OCDS Level 1 and offers very comfortable and powerful<br />
means for breakpoint generation. The BCU contains one comparator for<br />
• the arbitration phase (look for specific bus master)<br />
• the address phase (look for specific address or range)<br />
• the data phase (look for read, write, supervisor mode, etc.)<br />
The results can be combined to generate a break request signal, to be sent to the Break Switch<br />
(Cross Trigger Block).<br />
A.4.2 CPU or PCP OCDS Level 2 Trace<br />
Every trace clock cycle, 16 bits of CPU/PCP trace information are sent out, representing the<br />
current state of the CPU/PCP cores. The trace output lines are grouped into three parts:<br />
• 5 bits of pipeline status information<br />
• 8-bit indirect PC bus information<br />
• 3 bits of breakpoint qualification information<br />
With this information, an external emulator can reconstruct a cycle-by-cycle image of the<br />
instruction flow through the CPU or PCP. The trace information can be captured by the<br />
external debugger hardware and used to rebuild later on (off-line, using the source code)<br />
a cycle accurate disassembly of the code that has been executed. It is also possible to<br />
follow in real-time the current PC, facilitating advanced tools such as profilers, coverage<br />
analysis tools etc.<br />
The trace output port is controlled by the OSCU. The trace data can be output at CPU<br />
clock speed (fTRCLK = fCPU). Trace clock can be higher if two cores are traced or a better<br />
compression of trace data of all cores can keep this trace clock low.<br />
A.4.3 Concurrent <strong>Debug</strong>ging in Level 3 MCDS (Two Channel Tracing)<br />
A concurrent debugging is possible when the control port is used as second channel and<br />
ownership port is extended with process ID to differentiate between two sources that are traced.<br />
The debug setup must define which two cores or <strong>IP</strong>-blocks were selected for concurrent<br />
tracing.<br />
41 of 62<br />
© 2007 <strong>OCP</strong>-<strong>IP</strong> Association, All Rights Reserved.