Open Core Protocol Debug Interface Specification rev 1.0 - OCP-IP
Open Core Protocol Debug Interface Specification rev 1.0 - OCP-IP
Open Core Protocol Debug Interface Specification rev 1.0 - OCP-IP

Create successful ePaper yourself
Turn your PDF publications into a flip-book with our unique Google optimized e-Paper software.
<strong>OCP</strong>-<strong>IP</strong> Confidential<br />
Security concepts require enabling debug of sensitive locations only during chip validation and<br />
disabling it in the production chips. <strong>OCP</strong> security signaling is here extended to the debug<br />
socket so debug <strong>IP</strong> blocks can implement such concepts.<br />
Modern deep submicron processes overheat easily so power management by switching off<br />
clock and even switching off power supply to certain <strong>IP</strong> blocks is very popular. <strong>Debug</strong>ger shall<br />
not get locked or interrupted when dealing with such <strong>IP</strong> blocks if addressed accidentally in a<br />
debug session. Power-management debug signals help to avoid any confusion.<br />
Performance monitoring enables observation of selected threads, initiators, and targets to<br />
identify data traffic and measure data bandwidth. In all cases, they follow the point-to-point<br />
communication protocol and expose the <strong>OCP</strong> signaling to the debugger via a JTAG controlled<br />
or memory mapped registers.<br />
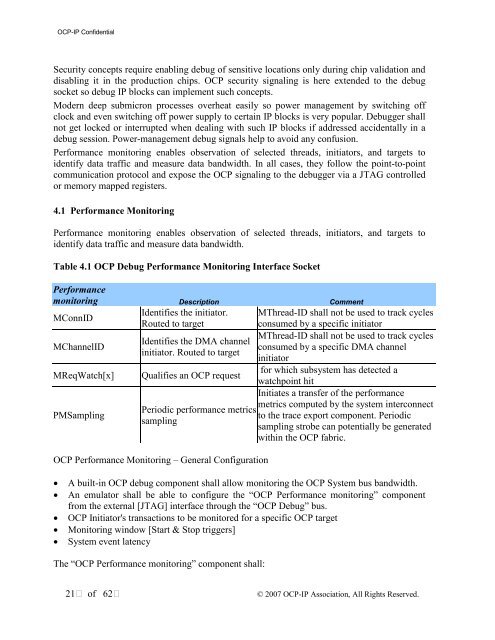
4.1 Performance Monitoring<br />
Performance monitoring enables observation of selected threads, initiators, and targets to<br />
identify data traffic and measure data bandwidth.<br />
Table 4.1 <strong>OCP</strong> <strong>Debug</strong> Performance Monitoring <strong>Interface</strong> Socket<br />
Performance<br />
monitoring Description Comment<br />
MConnID<br />
MChannelID<br />
MReqWatch[x]<br />
PMSampling<br />
Identifies the initiator.<br />
Routed to target<br />
Identifies the DMA channel<br />
initiator. Routed to target<br />
Qualifies an <strong>OCP</strong> request<br />
Periodic performance metrics<br />
sampling<br />
<strong>OCP</strong> Performance Monitoring – General Configuration<br />
MThread-ID shall not be used to track cycles<br />
consumed by a specific initiator<br />
MThread-ID shall not be used to track cycles<br />
consumed by a specific DMA channel<br />
initiator<br />
for which subsystem has detected a<br />
watchpoint hit<br />
Initiates a transfer of the performance<br />
metrics computed by the system interconnect<br />
to the trace export component. Periodic<br />
sampling strobe can potentially be generated<br />
within the <strong>OCP</strong> fabric.<br />
• A built-in <strong>OCP</strong> debug component shall allow monitoring the <strong>OCP</strong> System bus bandwidth.<br />
• An emulator shall be able to configure the “<strong>OCP</strong> Performance monitoring” component<br />
from the external [JTAG] interface through the “<strong>OCP</strong> <strong>Debug</strong>” bus.<br />
• <strong>OCP</strong> Initiator's transactions to be monitored for a specific <strong>OCP</strong> target<br />
• Monitoring window [Start & Stop triggers]<br />
• System event latency<br />
The “<strong>OCP</strong> Performance monitoring” component shall:<br />
21 of 62<br />
© 2007 <strong>OCP</strong>-<strong>IP</strong> Association, All Rights Reserved.