Engine Titanium Consortium - Center for Nondestructive Evaluation ...
Engine Titanium Consortium - Center for Nondestructive Evaluation ...
Engine Titanium Consortium - Center for Nondestructive Evaluation ...

Create successful ePaper yourself
Turn your PDF publications into a flip-book with our unique Google optimized e-Paper software.
must prepare a large number of specimens of varying defect sizes and conditions to per<strong>for</strong>m<br />
POD analyses <strong>for</strong> each new inspection geometry. The expense of this approach often leads to<br />
a best ef<strong>for</strong>t approach rather than a rigorous statistical study of the required number of<br />
samples.<br />
• Models make POD/PFA results transferable. For instance, suppose that the distributions have<br />
been determined <strong>for</strong> a given probe and the POD/PFA estimated. The model can then be used<br />
to transfer this POD/PFA result to another probe, with appropriate correction factors, because<br />
of the model’s ability to reliably predict relative signal strengths between one probe and<br />
another. Also, the model allows results to be transferred from one geometry [e.g., straight<br />
edges] to another geometry [e.g., slot edges]. Collectively, the use of models can reduce the<br />
cost and time requirements of POD/PFA analyses to more manageable levels in an<br />
environment where both inspection demands and opportunities are increasing. This results not<br />
only in cost savings, but more importantly, increases the likelihood that <strong>for</strong>mal POD/PFA<br />
estimates will be made with enhancement to safety and quantification of the benefits now<br />
possible.<br />
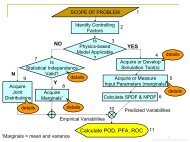
Figures 4 and 5 present flow diagrams of the work plan that has been developed to accomplish<br />
these goals, as is discussed in detail in the following text.<br />
a<br />
Notch<br />
& crack<br />
specimens<br />
h<br />
ET measurement<br />
b<br />
1D line/<br />
2D raster<br />
scan data<br />
g<br />
Physical probe<br />
response<br />
model<br />
(flaw & geometry)<br />
c<br />
Data<br />
analysis<br />
Validation<br />
Noise<br />
component<br />
Flaw<br />
signal<br />
Geometry<br />
signal<br />
d<br />
e<br />
Monte Carlo<br />
(Scan index,etc)<br />
f<br />
i<br />
Stat. model of<br />
noise<br />
distribution<br />
j<br />
Stat. model of<br />
signal<br />
distribution<br />
l<br />
Crack<br />
morphology<br />
database<br />
k<br />
POD, PFA,<br />
ROC<br />
Figure 4. Detailed experimental and validation plan <strong>for</strong> EC methodology.<br />
Quarterly Report – January 1, 2002 –March 31, 2002<br />
print date/time: 6/6/2002 - 8:39 AM – Page 107