Engine Titanium Consortium - Center for Nondestructive Evaluation ...
Engine Titanium Consortium - Center for Nondestructive Evaluation ...
Engine Titanium Consortium - Center for Nondestructive Evaluation ...

Create successful ePaper yourself
Turn your PDF publications into a flip-book with our unique Google optimized e-Paper software.
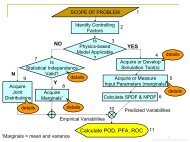
Measured Noise Levels in Honeywell Ti 6-4 Forging Coupons<br />
Noise Level<br />
(100 = #1 FBH in Ti 6-4) .<br />
8.00<br />
7.00<br />
6.00<br />
5.00<br />
4.00<br />
3.00<br />
2.00<br />
1.00<br />
Red: Peak Noise<br />
Blue: Ave. Noise<br />
Honeywell Forging<br />
9<br />
AFT<br />
1<br />
10<br />
4<br />
6<br />
7 8<br />
FWD<br />
AFT<br />
(side 2)<br />
5<br />
6<br />
2<br />
5<br />
3<br />
OD<br />
0.00<br />
3 4 5 6 7 8<br />
12 3 4 5 6 7 8 12 3 4 5 6 7 8 1 2 3 4 5 6 7 8 1 2 3 4 5 6 7 8 1 2 3 4 5 6 7 8 1 2 3 4 5 6 7 8 1 2 3 4 5 6 7 8 1 2<br />
H1<br />
H2<br />
H3<br />
H4<br />
H6<br />
H8<br />
Coupon, and Quadrant<br />
Coupon, Inspection Direction, and Quadrant<br />
H5<br />
H7<br />
ID<br />
(side 4)<br />
4<br />
1<br />
3 2<br />
8 7<br />
FWD<br />
(side 5)<br />
OD<br />
(side 1)<br />
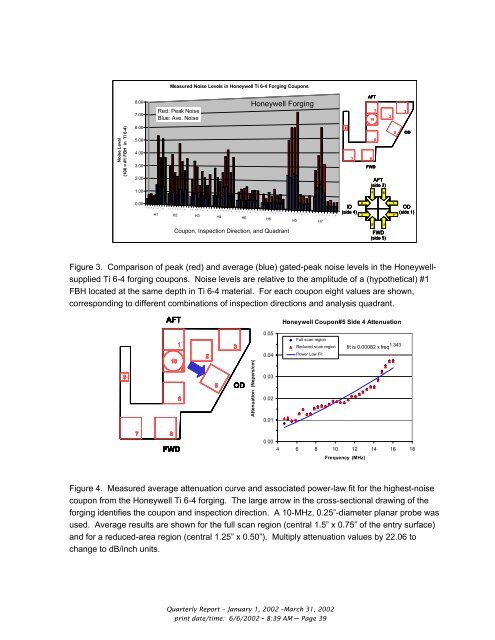
Figure 3. Comparison of peak (red) and average (blue) gated-peak noise levels in the Honeywellsupplied<br />
Ti 6-4 <strong>for</strong>ging coupons. Noise levels are relative to the amplitude of a (hypothetical) #1<br />
FBH located at the same depth in Ti 6-4 material. For each coupon eight values are shown,<br />
corresponding to different combinations of inspection directions and analysis quadrant.<br />
AFT<br />
Honeywell Coupon#5 Side 4 Attenuation<br />
9<br />
1<br />
2<br />
10<br />
4<br />
6<br />
5<br />
3<br />
OD<br />
Attenuation (Nepers/cm)<br />
0.05<br />
0.04<br />
0.03<br />
0.02<br />
0.01<br />
Full scan region<br />
Reduced scan region<br />
Power Law Fit<br />
fit is 0.00082 x freq 1.343<br />
7 8<br />
FWD<br />
0.00<br />
4 6 8 10 12 14 16 18<br />
Frequency (MHz)<br />
Figure 4. Measured average attenuation curve and associated power-law fit <strong>for</strong> the highest-noise<br />
coupon from the Honeywell Ti 6-4 <strong>for</strong>ging. The large arrow in the cross-sectional drawing of the<br />
<strong>for</strong>ging identifies the coupon and inspection direction. A 10-MHz, 0.25”-diameter planar probe was<br />
used. Average results are shown <strong>for</strong> the full scan region (central 1.5” x 0.75” of the entry surface)<br />
and <strong>for</strong> a reduced-area region (central 1.25” x 0.50”). Multiply attenuation values by 22.06 to<br />
change to dB/inch units.<br />
Quarterly Report – January 1, 2002 –March 31, 2002<br />
print date/time: 6/6/2002 - 8:39 AM – Page 39