Engine Titanium Consortium - Center for Nondestructive Evaluation ...
Engine Titanium Consortium - Center for Nondestructive Evaluation ...
Engine Titanium Consortium - Center for Nondestructive Evaluation ...

Create successful ePaper yourself
Turn your PDF publications into a flip-book with our unique Google optimized e-Paper software.
The average noise characteristics, as reflected by the rms-noise-versus-depth curves, are<br />
somewhat different <strong>for</strong> the different blocks. For each block the following procedure was used to<br />
determine a depth-dependent “microstructure difference factor”. (1) The measured rms-noiseversus<br />
depth curve was adjusted to remove the (minor) effect of electronic noise. (2)<br />
The six rms noise curves (one <strong>for</strong> each block) were averaged to determine the mean curve <strong>for</strong> the<br />
suite of coupons. This was done separately <strong>for</strong> each inspection water path. (3) The rms noise<br />
curve <strong>for</strong> a given coupon was divided by the mean curve to determine the fractional deviation from<br />
the mean at each metal depth. As shown in Figure 12, these difference factors were found to be<br />
nearly identical <strong>for</strong> the two inspections at different water paths, indicating that they do indeed arise<br />
from microstructural variations. (4) The difference factors measured <strong>for</strong> a given block using the 2.4”<br />
and 1.0” water paths were then averaged. In future analyses of grain noise measured through the<br />
curved surfaces of the blocks, these difference factors will be used (with the distance scale<br />
inverted) to “correct” noise quantities <strong>for</strong> microstructural differences. Remaining differences in<br />
noise properties will then presumable be due to surface curvature effects.<br />
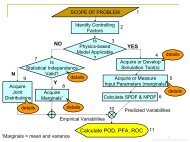
From the stored grain noise A-scans, other noise statistics can be readily computed. For example,<br />
<strong>for</strong> one typical block, Figure 13 shows gated-peak noise C-scans reconstructed from the flatsurface<br />
A-scan data <strong>for</strong> four choices of the time gate. As the gate is widened, keeping its center at<br />
the same depth, the average noise is seen to increase, as expected. Similar C-scan images were<br />
generated <strong>for</strong> all six coupons, and the average and maximal noise amplitude in each image was<br />
tabulated. Results are shown in graphical <strong>for</strong>m in Figure 14-15, where they are compared to the<br />
predictions of the ISU noise model (rightmost portion of each plot). The model the does a good job<br />
of predicting the average gated peak noise amplitude <strong>for</strong> each of the four gates. However, the<br />
theory tends to underestimate the maximum noise amplitude seen in a given C-scan. The current<br />
noise model assumes a uni<strong>for</strong>m “average” microstructure. The actual microstructure of a typical<br />
block varies only modestly with axial depth, but varies quite significantly with radial position, as can<br />
be seen in Figure 13. In the future the model <strong>for</strong> gated-peak noise statistics will be modified to<br />
account <strong>for</strong> such microstructural variations. This should improve predictions of maximal gated-peak<br />
noise amplitudes.<br />
Quarterly Report – January 1, 2002 –March 31, 2002<br />
print date/time: 6/6/2002 - 8:39 AM – Page 44