Engine Titanium Consortium - Center for Nondestructive Evaluation ...
Engine Titanium Consortium - Center for Nondestructive Evaluation ...
Engine Titanium Consortium - Center for Nondestructive Evaluation ...

Create successful ePaper yourself
Turn your PDF publications into a flip-book with our unique Google optimized e-Paper software.
Attenuation (dB/in) .<br />
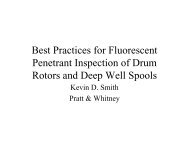
Waspalloy Attenuation at 7.5 MHz<br />
4.00<br />
3.50<br />
Axial<br />
3.00<br />
Hoop<br />
2.50<br />
Radial<br />
2.00<br />
1.50<br />
1.00<br />
0.50<br />
0.00<br />
0" 1" 2" 3" 4"<br />
(center)<br />
Measurement Site<br />
Attenuation (dB/in) .<br />
0.35<br />
0.30<br />
0.25<br />
0.20<br />
0.15<br />
0.10<br />
0.05<br />
0.00<br />
GFM-A Attenuation at 7.5 MHz<br />
Axial<br />
Hoop<br />
Radial<br />
0" 1" 2" 3" 4"<br />
(center)<br />
Measurement Site<br />
Attenuation (dB/in) .<br />
0.35<br />
0.30<br />
0.25<br />
0.20<br />
0.15<br />
0.10<br />
0.05<br />
0.00<br />
V-Die-A Attenuation at 7.5 MHz<br />
Axial<br />
Hoop<br />
Radial<br />
0" 1" 2" 3" 4"<br />
(center)<br />
Measurement Site<br />
Attenuation (dB/in) .<br />
V-Die-B Attenuation at 7.5 MHz<br />
0.16<br />
0.14<br />
0.12<br />
0.10<br />
0.08<br />
0.06<br />
0.04<br />
0.02<br />
0.00<br />
Axial<br />
Hoop<br />
Radial<br />
0" 1" 2" 3" 4"<br />
(center)<br />
Measurement Site<br />
Figure 7. Measured attenuation values at 7.5 MHz <strong>for</strong> the Ni billet specimens. Results are shown<br />
<strong>for</strong> three orthogonal inspection directions. The distance from each measurement site to the billet<br />
center is indicated.<br />
Attenuation at 7.5 MHz (dB/in)<br />
7<br />
6<br />
5<br />
4<br />
3<br />
2<br />
1<br />
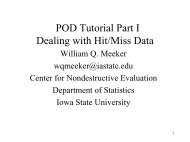
Correlation Between Measured Attenuation and<br />
Measured Average Grain Diameter<br />
GFM-A<br />
VDIE-A<br />
VDIE-B<br />
Wasp<br />
JT model <strong>for</strong> pure Ni<br />
Waspaloy Trendline<br />
Note : tw in boundares<br />
w ere not counted as bona<br />
fide grain boundaries.<br />
Attenuation at 7.5 MHz (dB/in)<br />
0.6<br />
0.5<br />
0.4<br />
0.3<br />
0.2<br />
0.1<br />
Correlation Between Measured Attenuation and<br />
Measured Average Grain Diameter<br />
GFM-A<br />
VDIE-A<br />
VDIE-B<br />
Wasp<br />
JT model <strong>for</strong> pure Ni<br />
IN718 Trendline<br />
Note : tw in boundares<br />
w ere not counted as bona<br />
fide grain boundaries.<br />
Vdie_A<br />
coupons<br />
H, I, L<br />
0<br />
0 20 40 60 80 100 120<br />
Estimated Grain Diameter (microns)<br />
0.0<br />
0 10 20 30 40<br />
Estimated Grain Diameter (microns)<br />
Figure 8. Correlation between measured attenuation at 7.5 MHz and estimated average grain<br />
diameter. Right panel shows a blow-up of the region near the plot origin. The prediction of the Joe<br />
Turner Attenuation Model (<strong>for</strong> pure Nickel) is shown <strong>for</strong> comparison, along with a trend lines<br />
through the data with the same shape as the model curve.<br />
Quarterly Report – January 1, 2002 –March 31, 2002<br />
print date/time: 6/6/2002 - 8:39 AM – Page 10