DARPA ULTRALOG Final Report - Industrial and Manufacturing ...
DARPA ULTRALOG Final Report - Industrial and Manufacturing ...
DARPA ULTRALOG Final Report - Industrial and Manufacturing ...

Create successful ePaper yourself
Turn your PDF publications into a flip-book with our unique Google optimized e-Paper software.
7<br />
respectively. In PA-O resources are allocated only at t=0 <strong>and</strong><br />
kept over time while in PA-C periodically (every 100 time<br />
units). PA-C is the resource control mechanism we have<br />
designed.<br />
B. Results<br />
TABLE I<br />
EXPERIMENTAL CONDITIONS<br />
Condition Distribution of P i rt i P i<br />
Con1-1 Deterministic [000 000 000 000 [04 12 04 08<br />
Con1-2 Exponential 200 200 200 200] 02 02 02 02]<br />
Con2-1 Deterministic [100 100 100 100 [04 12 04 10<br />
Con2-2 Exponential 200 200 200 200] 02 02 06 06]<br />
Con3-1 Deterministic [100 100 100 100 [04 12 04 10<br />
Con3-2 Exponential 200 200 200 100] 02 02 20 10]<br />
Con4-1 Deterministic [100 100 100 100 [04 12 04 08<br />
Con4-2 Exponential 200 200 200 200] 02 02 10 02]<br />
Con5-1 Deterministic [100 100 200 200 [04 10 04 08<br />
Con5-2 Exponential 200 200 200 200] 02 02 02 02]<br />
TABLE II<br />
CONTROL POLICIES FOR EXPERIMENTATION<br />
Control policy<br />
Description<br />
RR<br />
Round-Robin allocation<br />
PA-O Proportional allocation - Open loop<br />
PA-C Proportional allocation - Closed loop<br />
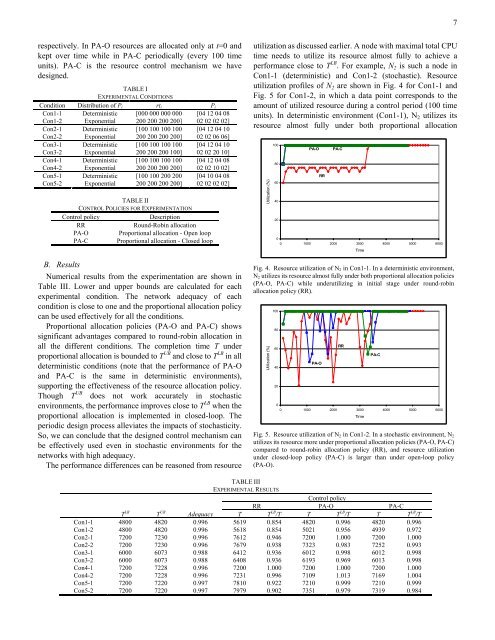
Numerical results from the experimentation are shown in<br />
Table III. Lower <strong>and</strong> upper bounds are calculated for each<br />
experimental condition. The network adequacy of each<br />
condition is close to one <strong>and</strong> the proportional allocation policy<br />
can be used effectively for all the conditions.<br />
Proportional allocation policies (PA-O <strong>and</strong> PA-C) shows<br />
significant advantages compared to round-robin allocation in<br />
all the different conditions. The completion time T under<br />
proportional allocation is bounded to T UB <strong>and</strong> close to T LB in all<br />
deterministic conditions (note that the performance of PA-O<br />
<strong>and</strong> PA-C is the same in deterministic environments),<br />
supporting the effectiveness of the resource allocation policy.<br />
Though T UB does not work accurately in stochastic<br />
environments, the performance improves close to T LB when the<br />
proportional allocation is implemented in closed-loop. The<br />
periodic design process alleviates the impacts of stochasticity.<br />
So, we can conclude that the designed control mechanism can<br />
be effectively used even in stochastic environments for the<br />
networks with high adequacy.<br />
The performance differences can be reasoned from resource<br />
utilization as discussed earlier. A node with maximal total CPU<br />
time needs to utilize its resource almost fully to achieve a<br />
performance close to T LB . For example, N 2 is such a node in<br />
Con1-1 (deterministic) <strong>and</strong> Con1-2 (stochastic). Resource<br />
utilization profiles of N 2 are shown in Fig. 4 for Con1-1 <strong>and</strong><br />
Fig. 5 for Con1-2, in which a data point corresponds to the<br />
amount of utilized resource during a control period (100 time<br />
units). In deterministic environment (Con1-1), N 2 utilizes its<br />
resource almost fully under both proportional allocation<br />
Utilization (%)<br />
100<br />
80<br />
60<br />
40<br />
20<br />
PA-O<br />
RR<br />
PA-C<br />
0<br />
0 1000 2000 3000 4000 5000 6000<br />
Fig. 4. Resource utilization of N 2 in Con1-1. In a deterministic environment,<br />
N 2 utilizes its resource almost fully under both proportional allocation policies<br />
(PA-O, PA-C) while underutilizing in initial stage under round-robin<br />
allocation policy (RR).<br />
Utilization (%)<br />
100<br />
80<br />
60<br />
40<br />
20<br />
PA-O<br />
RR<br />
Time<br />
0<br />
0 1000 2000 3000 4000 5000 6000<br />
Fig. 5. Resource utilization of N 2 in Con1-2. In a stochastic environment, N 2<br />
utilizes its resource more under proportional allocation policies (PA-O, PA-C)<br />
compared to round-robin allocation policy (RR), <strong>and</strong> resource utilization<br />
under closed-loop policy (PA-C) is larger than under open-loop policy<br />
(PA-O).<br />
Time<br />
PA-C<br />
TABLE III<br />
EXPERIMENTAL RESULTS<br />
Control policy<br />
RR PA-O PA-C<br />
T LB T UB Adequacy T T LB /T T T LB /T T T LB /T<br />
Con1-1 4800 4820 0.996 5619 0.854 4820 0.996 4820 0.996<br />
Con1-2 4800 4820 0.996 5618 0.854 5021 0.956 4939 0.972<br />
Con2-1 7200 7230 0.996 7612 0.946 7200 1.000 7200 1.000<br />
Con2-2 7200 7230 0.996 7679 0.938 7323 0.983 7252 0.993<br />
Con3-1 6000 6073 0.988 6412 0.936 6012 0.998 6012 0.998<br />
Con3-2 6000 6073 0.988 6408 0.936 6193 0.969 6013 0.998<br />
Con4-1 7200 7228 0.996 7200 1.000 7200 1.000 7200 1.000<br />
Con4-2 7200 7228 0.996 7231 0.996 7109 1.013 7169 1.004<br />
Con5-1 7200 7220 0.997 7810 0.922 7210 0.999 7210 0.999<br />
Con5-2 7200 7220 0.997 7979 0.902 7351 0.979 7319 0.984