DARPA ULTRALOG Final Report - Industrial and Manufacturing ...
DARPA ULTRALOG Final Report - Industrial and Manufacturing ...
DARPA ULTRALOG Final Report - Industrial and Manufacturing ...

You also want an ePaper? Increase the reach of your titles
YUMPU automatically turns print PDFs into web optimized ePapers that Google loves.
5<br />
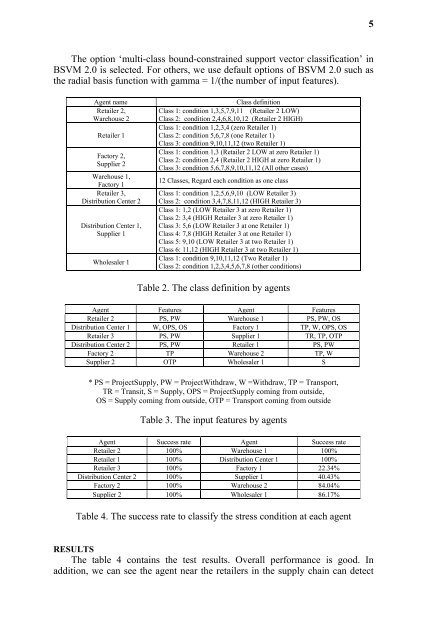
The option ‘multi-class bound-constrained support vector classification’ in<br />
BSVM 2.0 is selected. For others, we use default options of BSVM 2.0 such as<br />
the radial basis function with gamma = 1/(the number of input features).<br />
Agent name<br />
Retailer 2,<br />
Warehouse 2<br />
Retailer 1<br />
Factory 2,<br />
Supplier 2<br />
Warehouse 1,<br />
Factory 1<br />
Retailer 3,<br />
Distribution Center 2<br />
Distribution Center 1,<br />
Supplier 1<br />
Wholesaler 1<br />
Class definition<br />
Class 1: condition 1,3,5,7,9,11 (Retailer 2 LOW)<br />
Class 2: condition 2,4,6,8,10,12 (Retailer 2 HIGH)<br />
Class 1: condition 1,2,3,4 (zero Retailer 1)<br />
Class 2: condition 5,6,7,8 (one Retailer 1)<br />
Class 3: condition 9,10,11,12 (two Retailer 1)<br />
Class 1: condition 1,3 (Retailer 2 LOW at zero Retailer 1)<br />
Class 2: condition 2,4 (Retailer 2 HIGH at zero Retailer 1)<br />
Class 3: condition 5,6,7,8,9,10,11,12 (All other cases)<br />
12 Classes, Regard each condition as one class<br />
Class 1: condition 1,2,5,6,9,10 (LOW Retailer 3)<br />
Class 2: condition 3,4,7,8,11,12 (HIGH Retailer 3)<br />
Class 1: 1,2 (LOW Retailer 3 at zero Retailer 1)<br />
Class 2: 3,4 (HIGH Retailer 3 at zero Retailer 1)<br />
Class 3: 5,6 (LOW Retailer 3 at one Retailer 1)<br />
Class 4: 7,8 (HIGH Retailer 3 at one Retailer 1)<br />
Class 5: 9,10 (LOW Retailer 3 at two Retailer 1)<br />
Class 6: 11,12 (HIGH Retailer 3 at two Retailer 1)<br />
Class 1: condition 9,10,11,12 (Two Retailer 1)<br />
Class 2: condition 1,2,3,4,5,6,7,8 (other conditions)<br />
Table 2. The class definition by agents<br />
Agent Features Agent Features<br />
Retailer 2 PS, PW Warehouse 1 PS, PW, OS<br />
Distribution Center 1 W, OPS, OS Factory 1 TP, W, OPS, OS<br />
Retailer 3 PS, PW Supplier 1 TR, TP, OTP<br />
Distribution Center 2 PS, PW Retailer 1 PS, PW<br />
Factory 2 TP Warehouse 2 TP, W<br />
Supplier 2 OTP Wholesaler 1 S<br />
* PS = ProjectSupply, PW = ProjectWithdraw, W =Withdraw, TP = Transport,<br />
TR = Transit, S = Supply, OPS = ProjectSupply coming from outside,<br />
OS = Supply coming from outside, OTP = Transport coming from outside<br />
Table 3. The input features by agents<br />
Agent Success rate Agent Success rate<br />
Retailer 2 100% Warehouse 1 100%<br />
Retailer 1 100% Distribution Center 1 100%<br />
Retailer 3 100% Factory 1 22.34%<br />
Distribution Center 2 100% Supplier 1 40.43%<br />
Factory 2 100% Warehouse 2 84.04%<br />
Supplier 2 100% Wholesaler 1 86.17%<br />
Table 4. The success rate to classify the stress condition at each agent<br />
RESULTS<br />
The table 4 contains the test results. Overall performance is good. In<br />
addition, we can see the agent near the retailers in the supply chain can detect