DARPA ULTRALOG Final Report - Industrial and Manufacturing ...
DARPA ULTRALOG Final Report - Industrial and Manufacturing ...
DARPA ULTRALOG Final Report - Industrial and Manufacturing ...

Create successful ePaper yourself
Turn your PDF publications into a flip-book with our unique Google optimized e-Paper software.
the system starts to perform self-sustained oscillations. The amplitude of these oscillations is<br />
finally limited by the various nonlinear restrictions in the model, particularly by the reduction of<br />
resource transfer rate as lower limits to resources in production or resources in sales are<br />
approached.<br />
A series of abrupt changes in the system behavior is observed as competition between the basic<br />
growth tendency <strong>and</strong> nonlinear limiting factors is shifted. The simple one-cycle attractor<br />
corresponding to H=10, becomes unstable for H=13 <strong>and</strong> a new stable attractor with twice the<br />
original period arises. If H is increased to 28 the stable attractor attains a period of 4. As H is<br />
further increased, the period-doubling bifurcations continue until H=30 the threshold to chaos is<br />
exceeded. The system now starts to behave in an aperiodic <strong>and</strong> apparently r<strong>and</strong>om behavior.<br />
Hence the system shows chaotic behavior through a series of period doubling bifurcations.<br />
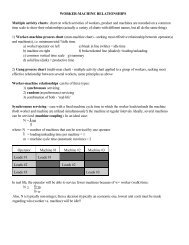
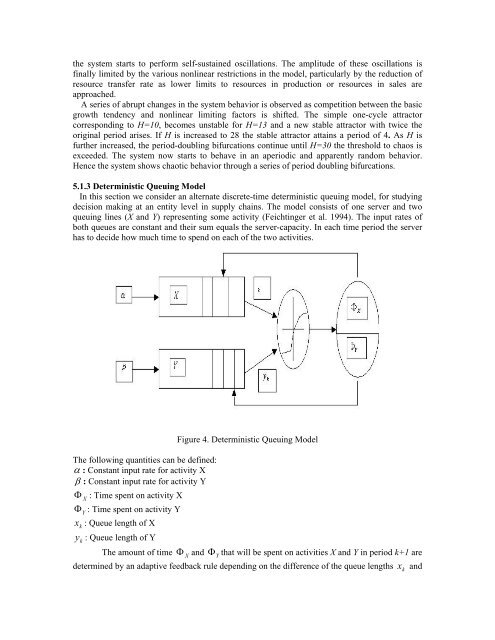
5.1.3 Deterministic Queuing Model<br />
In this section we consider an alternate discrete-time deterministic queuing model, for studying<br />
decision making at an entity level in supply chains. The model consists of one server <strong>and</strong> two<br />
queuing lines (X <strong>and</strong> Y) representing some activity (Feichtinger et al. 1994). The input rates of<br />
both queues are constant <strong>and</strong> their sum equals the server-capacity. In each time period the server<br />
has to decide how much time to spend on each of the two activities.<br />
The following quantities can be defined:<br />
α : Constant input rate for activity X<br />
β : Constant input rate for activity Y<br />
Φ<br />
X<br />
: Time spent on activity X<br />
Φ<br />
Y<br />
: Time spent on activity Y<br />
x : Queue length of X<br />
k<br />
y : Queue length of Y<br />
k<br />
The amount of time<br />
Figure 4. Deterministic Queuing Model<br />
Φ<br />
X<br />
<strong>and</strong> Φ that will be spent on activities X <strong>and</strong> Y in period k+1 are<br />
Y<br />
determined by an adaptive feedback rule depending on the difference of the queue lengths<br />
x k<br />
<strong>and</strong>