DARPA ULTRALOG Final Report - Industrial and Manufacturing ...
DARPA ULTRALOG Final Report - Industrial and Manufacturing ...
DARPA ULTRALOG Final Report - Industrial and Manufacturing ...

You also want an ePaper? Increase the reach of your titles
YUMPU automatically turns print PDFs into web optimized ePapers that Google loves.
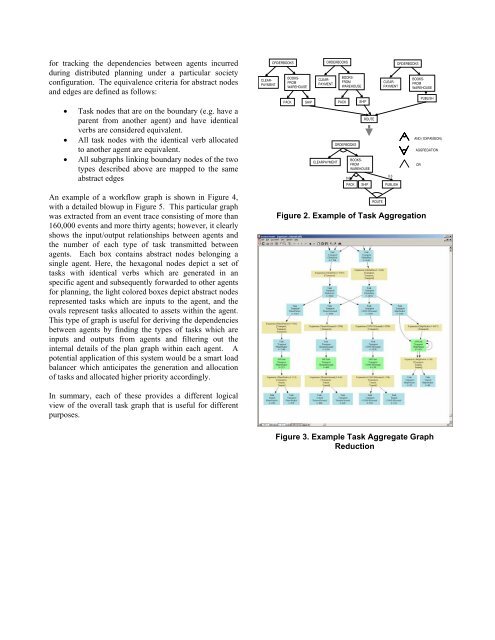
for tracking the dependencies between agents incurred<br />
during distributed planning under a particular society<br />
configuration. The equivalence criteria for abstract nodes<br />
<strong>and</strong> edges are defined as follows:<br />
• Task nodes that are on the boundary (e.g. have a<br />
parent from another agent) <strong>and</strong> have identical<br />
verbs are considered equivalent.<br />
• All task nodes with the identical verb allocated<br />
to another agent are equivalent.<br />
• All subgraphs linking boundary nodes of the two<br />
types described above are mapped to the same<br />
abstract edges<br />
CLEAR-<br />
PAYMENT<br />
ORDERBOOKS<br />
BOOKS-<br />
FROM<br />
WAREHOUSE<br />
PACK<br />
SHIP<br />
CLEAR-<br />
PAYMENT<br />
ORDERBOOKS<br />
CLEARPAYMENT<br />
BOOKS-<br />
FROM<br />
WAREHOUSE<br />
PACK<br />
ORDERBOOKS<br />
SHIP<br />
ROUTE<br />
BOOKS-<br />
FROM<br />
WAREHOUSE<br />
0.6<br />
PACK<br />
SHIP<br />
CLEAR-<br />
PAYMENT<br />
0.3<br />
PUBLISH<br />
ORDERBOOKS<br />
BOOKS-<br />
FROM<br />
WAREHOUSE<br />
PUBLISH<br />
AND ( EXPANSION)<br />
AGGREGATION<br />
OR<br />
An example of a workflow graph is shown in Figure 4,<br />
with a detailed blowup in Figure 5. This particular graph<br />
was extracted from an event trace consisting of more than<br />
160,000 events <strong>and</strong> more thirty agents; however, it clearly<br />
shows the input/output relationships between agents <strong>and</strong><br />
the number of each type of task transmitted between<br />
agents. Each box contains abstract nodes belonging a<br />
single agent. Here, the hexagonal nodes depict a set of<br />
tasks with identical verbs which are generated in an<br />
specific agent <strong>and</strong> subsequently forwarded to other agents<br />
for planning, the light colored boxes depict abstract nodes<br />
represented tasks which are inputs to the agent, <strong>and</strong> the<br />
ovals represent tasks allocated to assets within the agent.<br />
This type of graph is useful for deriving the dependencies<br />
between agents by finding the types of tasks which are<br />
inputs <strong>and</strong> outputs from agents <strong>and</strong> filtering out the<br />
internal details of the plan graph within each agent. A<br />
potential application of this system would be a smart load<br />
balancer which anticipates the generation <strong>and</strong> allocation<br />
of tasks <strong>and</strong> allocated higher priority accordingly.<br />
ROUTE<br />
Figure 2. Example of Task Aggregation<br />
In summary, each of these provides a different logical<br />
view of the overall task graph that is useful for different<br />
purposes.<br />
Figure 3. Example Task Aggregate Graph<br />
Reduction