DARPA ULTRALOG Final Report - Industrial and Manufacturing ...
DARPA ULTRALOG Final Report - Industrial and Manufacturing ...
DARPA ULTRALOG Final Report - Industrial and Manufacturing ...

Create successful ePaper yourself
Turn your PDF publications into a flip-book with our unique Google optimized e-Paper software.
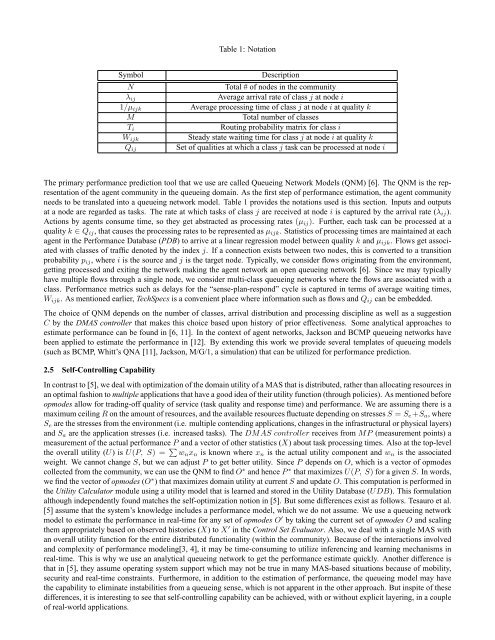
Table 1: Notation<br />
Symbol<br />
Description<br />
N<br />
Total # of nodes in the community<br />
λ ij<br />
Average arrival rate of class j at node i<br />
1/µ ijk Average processing time of class j at node i at quality k<br />
M<br />
Total number of classes<br />
T i<br />
Routing probability matrix for class i<br />
W ijk<br />
Steady state waiting time for class j at node i at quality k<br />
Set of qualities at which a class j task can be processed at node i<br />
Q ij<br />
The primary performance prediction tool that we use are called Queueing Network Models (QNM) [6]. The QNM is the representation<br />
of the agent community in the queueing domain. As the first step of performance estimation, the agent community<br />
needs to be translated into a queueing network model. Table 1 provides the notations used is this section. Inputs <strong>and</strong> outputs<br />
at a node are regarded as tasks. The rate at which tasks of class j are received at node i is captured by the arrival rate (λ ij ).<br />
Actions by agents consume time, so they get abstracted as processing rates (µ ij ). Further, each task can be processed at a<br />
quality k ∈ Q ij , that causes the processing rates to be represented as µ ijk . Statistics of processing times are maintained at each<br />
agent in the Performance Database (PDB) to arrive at a linear regression model between quality k <strong>and</strong> µ ijk . Flows get associated<br />
with classes of traffic denoted by the index j. If a connection exists between two nodes, this is converted to a transition<br />
probability p ij , where i is the source <strong>and</strong> j is the target node. Typically, we consider flows originating from the environment,<br />
getting processed <strong>and</strong> exiting the network making the agent network an open queueing network [6]. Since we may typically<br />
have multiple flows through a single node, we consider multi-class queueing networks where the flows are associated with a<br />
class. Performance metrics such as delays for the “sense-plan-respond” cycle is captured in terms of average waiting times,<br />
W ijk . As mentioned earlier, TechSpecs is a convenient place where information such as flows <strong>and</strong> Q ij can be embedded.<br />
The choice of QNM depends on the number of classes, arrival distribution <strong>and</strong> processing discipline as well as a suggestion<br />
C by the DMAS controller that makes this choice based upon history of prior effectiveness. Some analytical approaches to<br />
estimate performance can be found in [6, 11]. In the context of agent networks, Jackson <strong>and</strong> BCMP queueing networks have<br />
been applied to estimate the performance in [12]. By extending this work we provide several templates of queueing models<br />
(such as BCMP, Whitt’s QNA [11], Jackson, M/G/1, a simulation) that can be utilized for performance prediction.<br />
2.5 Self-Controlling Capability<br />
In contrast to [5], we deal with optimization of the domain utility of a MAS that is distributed, rather than allocating resources in<br />
an optimal fashion to multiple applications that have a good idea of their utility function (through policies). As mentioned before<br />
opmodes allow for trading-off quality of service (task quality <strong>and</strong> response time) <strong>and</strong> performance. We are assuming there is a<br />
maximum ceiling R on the amount of resources, <strong>and</strong> the available resources fluctuate depending on stresses S = S e +S a , where<br />
S e are the stresses from the environment (i.e. multiple contending applications, changes in the infrastructural or physical layers)<br />
<strong>and</strong> S a are the application stresses (i.e. increased tasks). The DMAS controller receives from MP (measurement points) a<br />
measurement of the actual performance P <strong>and</strong> a vector of other statistics (X) about task processing times. Also at the top-level<br />
the overall utility (U) is U(P, S) = ∑ w n x n is known where x n is the actual utility component <strong>and</strong> w n is the associated<br />
weight. We cannot change S, but we can adjust P to get better utility. Since P depends on O, which is a vector of opmodes<br />
collected from the community, we can use the QNM to find O ∗ <strong>and</strong> hence P ∗ that maximizes U(P, S) for a given S. In words,<br />
we find the vector of opmodes (O ∗ ) that maximizes domain utility at current S <strong>and</strong> update O. This computation is performed in<br />
the Utility Calculator module using a utility model that is learned <strong>and</strong> stored in the Utility Database (UDB). This formulation<br />
although independently found matches the self-optimization notion in [5]. But some differences exist as follows. Tesauro et al.<br />
[5] assume that the system’s knowledge includes a performance model, which we do not assume. We use a queueing network<br />
model to estimate the performance in real-time for any set of opmodes O ′ by taking the current set of opmodes O <strong>and</strong> scaling<br />
them appropriately based on observed histories (X) to X ′ in the Control Set Evaluator. Also, we deal with a single MAS with<br />
an overall utility function for the entire distributed functionality (within the community). Because of the interactions involved<br />
<strong>and</strong> complexity of performance modeling[3, 4], it may be time-consuming to utilize inferencing <strong>and</strong> learning mechanisms in<br />
real-time. This is why we use an analytical queueing network to get the performance estimate quickly. Another difference is<br />
that in [5], they assume operating system support which may not be true in many MAS-based situations because of mobility,<br />
security <strong>and</strong> real-time constraints. Furthermore, in addition to the estimation of performance, the queueing model may have<br />
the capability to eliminate instabilities from a queueing sense, which is not apparent in the other approach. But inspite of these<br />
differences, it is interesting to see that self-controlling capability can be achieved, with or without explicit layering, in a couple<br />
of real-world applications.