DARPA ULTRALOG Final Report - Industrial and Manufacturing ...
DARPA ULTRALOG Final Report - Industrial and Manufacturing ...
DARPA ULTRALOG Final Report - Industrial and Manufacturing ...

You also want an ePaper? Increase the reach of your titles
YUMPU automatically turns print PDFs into web optimized ePapers that Google loves.
Growth mechanisms<br />
Start with a small number of nodes—say,<br />
m 0 —<strong>and</strong> assume that every time a node<br />
enters the system, m edges are pointing from<br />
it, where m < m 0 . Battalions, FSBs, <strong>and</strong><br />
MSBs enter the system in a certain ratio<br />
l:m:n where l > m > n:<br />
• A battalion has one edge pointing from it<br />
<strong>and</strong> a second edge added with a probability<br />
p.<br />
• An FSB has three edges pointing from it.<br />
• An MSB has five edges pointing from it.<br />
The attachment rules applied depend on<br />
which node type enters the system:<br />
• For a battalion, the first edge attaches to a<br />
node i of degree k i with the probability<br />
ki<br />
Π i =<br />
∑ k<br />
.<br />
j<br />
j<br />
The second edge, which exists with a<br />
probability p, attaches to a r<strong>and</strong>omly chosen<br />
node at a distance of two.<br />
• For an FSB, the first edge attaches to a<br />
node i of degree k i with the probability<br />
ki<br />
Π i =<br />
∑ k<br />
.<br />
j<br />
j<br />
The subsequent edges attach to a r<strong>and</strong>omly<br />
chosen node at a distance of at most three.<br />
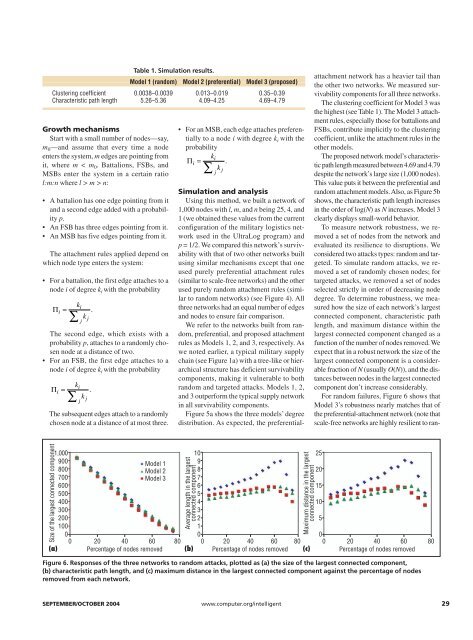
Table 1. Simulation results.<br />
Model 1 (r<strong>and</strong>om) Model 2 (preferential) Model 3 (proposed)<br />
Clustering coefficient 0.0038–0.0039 0.013–0.019 0.35–0.39<br />
Characteristic path length 5.26–5.36 4.09–4.25 4.69–4.79<br />
• For an MSB, each edge attaches preferentially<br />
to a node i with degree k i with the<br />
probability<br />
ki<br />
Π i =<br />
∑ k<br />
.<br />
j<br />
j<br />
Simulation <strong>and</strong> analysis<br />
Using this method, we built a network of<br />
1,000 nodes with l, m, <strong>and</strong> n being 25, 4, <strong>and</strong><br />
1 (we obtained these values from the current<br />
configuration of the military logistics network<br />
used in the UltraLog program) <strong>and</strong><br />
p = 1/2. We compared this network’s survivability<br />
with that of two other networks built<br />
using similar mechanisms except that one<br />
used purely preferential attachment rules<br />
(similar to scale-free networks) <strong>and</strong> the other<br />
used purely r<strong>and</strong>om attachment rules (similar<br />
to r<strong>and</strong>om networks) (see Figure 4). All<br />
three networks had an equal number of edges<br />
<strong>and</strong> nodes to ensure fair comparison.<br />
We refer to the networks built from r<strong>and</strong>om,<br />
preferential, <strong>and</strong> proposed attachment<br />
rules as Models 1, 2, <strong>and</strong> 3, respectively. As<br />
we noted earlier, a typical military supply<br />
chain (see Figure 1a) with a tree-like or hierarchical<br />
structure has deficient survivability<br />
components, making it vulnerable to both<br />
r<strong>and</strong>om <strong>and</strong> targeted attacks. Models 1, 2,<br />
<strong>and</strong> 3 outperform the typical supply network<br />
in all survivability components.<br />
Figure 5a shows the three models’ degree<br />
distribution. As expected, the preferentialattachment<br />
network has a heavier tail than<br />
the other two networks. We measured survivability<br />
components for all three networks.<br />
The clustering coefficient for Model 3 was<br />
the highest (see Table 1). The Model 3 attachment<br />
rules, especially those for battalions <strong>and</strong><br />
FSBs, contribute implicitly to the clustering<br />
coefficient, unlike the attachment rules in the<br />
other models.<br />
The proposed network model’s characteristic<br />
path length measured between 4.69 <strong>and</strong> 4.79<br />
despite the network’s large size (1,000 nodes).<br />
This value puts it between the preferential <strong>and</strong><br />
r<strong>and</strong>om attachment models. Also, as Figure 5b<br />
shows, the characteristic path length increases<br />
in the order of log(N) as N increases. Model 3<br />
clearly displays small-world behavior.<br />
To measure network robustness, we removed<br />
a set of nodes from the network <strong>and</strong><br />
evaluated its resilience to disruptions. We<br />
considered two attacks types: r<strong>and</strong>om <strong>and</strong> targeted.<br />
To simulate r<strong>and</strong>om attacks, we removed<br />
a set of r<strong>and</strong>omly chosen nodes; for<br />
targeted attacks, we removed a set of nodes<br />
selected strictly in order of decreasing node<br />
degree. To determine robustness, we measured<br />
how the size of each network’s largest<br />
connected component, characteristic path<br />
length, <strong>and</strong> maximum distance within the<br />
largest connected component changed as a<br />
function of the number of nodes removed. We<br />
expect that in a robust network the size of the<br />
largest connected component is a considerable<br />
fraction of N (usually O(N)), <strong>and</strong> the distances<br />
between nodes in the largest connected<br />
component don’t increase considerably.<br />
For r<strong>and</strong>om failures, Figure 6 shows that<br />
Model 3’s robustness nearly matches that of<br />
the preferential-attachment network (note that<br />
scale-free networks are highly resilient to ran-<br />
Size of the largest connected component<br />
1,000<br />
900<br />
800<br />
700<br />
600<br />
500<br />
400<br />
300<br />
200<br />
100<br />
0<br />
(a)<br />
Model 1<br />
Model 2<br />
Model 3<br />
0 20 40 60 80<br />
Percentage of nodes removed<br />
Average length in the largest<br />
connected component<br />
10<br />
9<br />
8<br />
7<br />
6<br />
5<br />
4<br />
3<br />
Maximum distance in the largest<br />
connected component<br />
2<br />
1<br />
0<br />
0 20 40 60 80<br />
(b) Percentage of nodes removed (c)<br />
25<br />
20<br />
15<br />
10<br />
5<br />
0<br />
0 20 40 60 80<br />
Percentage of nodes removed<br />
Figure 6. Responses of the three networks to r<strong>and</strong>om attacks, plotted as (a) the size of the largest connected component,<br />
(b) characteristic path length, <strong>and</strong> (c) maximum distance in the largest connected component against the percentage of nodes<br />
removed from each network.<br />
SEPTEMBER/OCTOBER 2004 www.computer.org/intelligent 29