Annual Report 2010 (PDF, 5.2MB) - Panalpina Annual Report 2012
Annual Report 2010 (PDF, 5.2MB) - Panalpina Annual Report 2012
Annual Report 2010 (PDF, 5.2MB) - Panalpina Annual Report 2012

Create successful ePaper yourself
Turn your PDF publications into a flip-book with our unique Google optimized e-Paper software.
Consolidated and <strong>Annual</strong> Financial Statements <strong>2010</strong><br />
104<br />
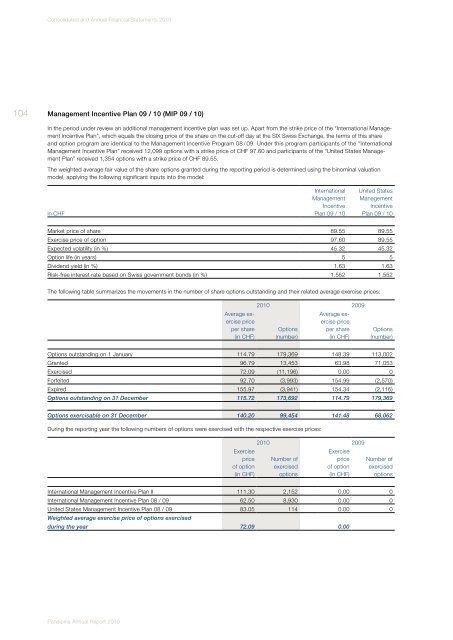
Management Incentive Plan 09 / 10 (MIP 09 / 10)<br />
In the period under review an additional management incentive plan was set up. Apart from the strike price of the “International Management<br />
Incentive Plan”, which equals the closing price of the share on the cut-off day at the SIX Swiss Exchange, the terms of this share<br />
and option program are identical to the Management Incentive Program 08 / 09. Under this program participants of the “International<br />
Management Incentive Plan” received 12,099 options with a strike price of CHF 97.60 and participants of the “United States Management<br />
Plan” received 1,354 options with a strike price of CHF 89.55.<br />
The weighted average fair value of the share options granted during the reporting period is determined using the binominal valuation<br />
model, applying the following significant inputs into the model:<br />
in CHF<br />
International<br />
Management<br />
Incentive<br />
Plan 09 / 10<br />
United States<br />
Management<br />
Incentive<br />
Plan 09 / 10<br />
Market price of share 89.55 89.55<br />
Exercise price of option 97.60 89.55<br />
Expected volatility (in %) 45.32 45.32<br />
Option life (in years) 5 5<br />
Dividend yield (in %) 1.63 1.63<br />
Risk-free interest rate based on Swiss government bonds (in %) 1.552 1.552<br />
The following table summarizes the movements in the number of share options outstanding and their related average exercise prices:<br />
Average exercise<br />
price<br />
per share<br />
(in CHF)<br />
<strong>2010</strong> 2009<br />
Options<br />
(number)<br />
Average exercise<br />
price<br />
per share<br />
(in CHF)<br />
Options<br />
(number)<br />
Options outstanding on 1 January 114.79 179,369 148.39 113,002<br />
Granted 96.79 13,453 63.98 71,053<br />
Exercised 72.09 (11,196) 0.00 0<br />
Forfeited 92.70 (3,993) 154.99 (2,570)<br />
Expired 155.97 (3,941) 154.34 (2,116)<br />
Options outstanding on 31 December 115.72 173,692 114.79 179,369<br />
Options exercisable on 31 December 140.20 99,454 141.48 68,062<br />
During the reporting year the following numbers of options were exercised with the respective exercise prices:<br />
Exercise<br />
price<br />
of option<br />
(in CHF)<br />
<strong>2010</strong> 2009<br />
Number of<br />
exercised<br />
options<br />
Exercise<br />
price<br />
of option<br />
(in CHF)<br />
Number of<br />
exercised<br />
options<br />
International Management Incentive Plan II 111.30 2,152 0.00 0<br />
International Management Incentive Plan 08 / 09 62.50 8,930 0.00 0<br />
United States Management Incentive Plan 08 / 09 83.05 114 0.00 0<br />
Weighted average exercise price of options exercised<br />
during the year 72.09 0.00<br />
<strong>Panalpina</strong> <strong>Annual</strong> <strong>Report</strong> <strong>2010</strong>