Annual Report 2010 (PDF, 5.2MB) - Panalpina Annual Report 2012
Annual Report 2010 (PDF, 5.2MB) - Panalpina Annual Report 2012
Annual Report 2010 (PDF, 5.2MB) - Panalpina Annual Report 2012

You also want an ePaper? Increase the reach of your titles
YUMPU automatically turns print PDFs into web optimized ePapers that Google loves.
<strong>Report</strong>s of the Board of Directors and the Executive Board<br />
14<br />
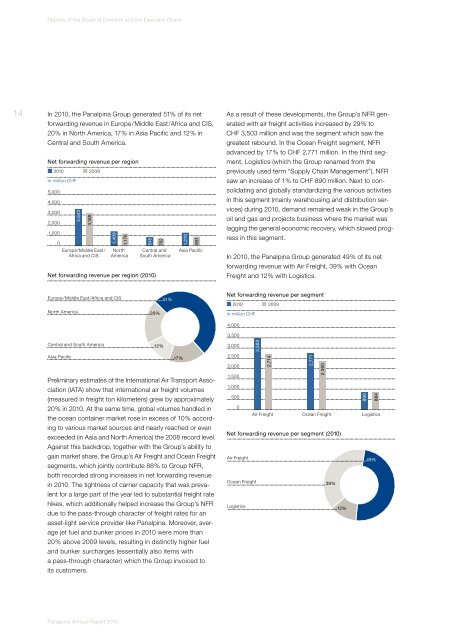
In <strong>2010</strong>, the <strong>Panalpina</strong> Group generated 51 % of its net<br />
forwarding revenue in Europe / Middle East / Africa and CIS,<br />
20 % in North America, 17 % in Asia Pacific and 12 % in<br />
Central and South America.<br />
Net forwarding revenue per region<br />
<strong>2010</strong> 2009<br />
in million CHF<br />
5,000<br />
4,000<br />
3,000<br />
2,000<br />
1,000<br />
0<br />
3,640<br />
3,189<br />
Europe/Middle East/<br />
Africa and CIS<br />
1,409<br />
1,176<br />
North<br />
America<br />
845<br />
702<br />
Central and<br />
South America<br />
Net forwarding revenue per region (<strong>2010</strong>)<br />
1,270<br />
891<br />
Asia Pacific<br />
As a result of these developments, the Group’s NFR generated<br />
with air freight activities increased by 29 % to<br />
CHF 3,503 million and was the segment which saw the<br />
greatest rebound. In the Ocean Freight segment, NFR<br />
advanced by 17 % to CHF 2,771 million. In the third segment,<br />
Logistics (which the Group renamed from the<br />
previously used term “Supply Chain Management”), NFR<br />
saw an increase of 1 % to CHF 890 million. Next to consolidating<br />
and globally standardizing the various activities<br />
in this segment (mainly warehousing and distribution services)<br />
during <strong>2010</strong>, demand remained weak in the Group’s<br />
oil and gas and projects business where the market was<br />
lagging the general economic recovery, which slowed progress<br />
in this segment.<br />
In <strong>2010</strong>, the <strong>Panalpina</strong> Group generated 49 % of its net<br />
forwarding revenue with Air Freight, 39 % with Ocean<br />
Freight and 12 % with Logistics.<br />
Europe /Middle East/Africa and CIS<br />
North America<br />
20%<br />
51%<br />
Net forwarding revenue per segment<br />
<strong>2010</strong> 2009<br />
in million CHF<br />
4,000<br />
3,500<br />
Central and South America<br />
12%<br />
Asia Pacific 17%<br />
Preliminary estimates of the International Air Transport Association<br />
(IATA) show that international air freight volumes<br />
(measured in freight ton kilometers) grew by approximately<br />
20 % in <strong>2010</strong>. At the same time, global volumes handled in<br />
the ocean container market rose in excess of 10 % according<br />
to various market sources and nearly reached or even<br />
exceeded (in Asia and North America) the 2008 record level.<br />
Against this backdrop, together with the Group’s ability to<br />
gain market share, the Group’s Air Freight and Ocean Freight<br />
segments, which jointly contribute 88 % to Group NFR,<br />
both recorded strong increases in net forwarding revenue<br />
in <strong>2010</strong>. The tightness of carrier capacity that was prevalent<br />
for a large part of the year led to substantial freight rate<br />
hikes, which additionally helped increase the Group’s NFR<br />
due to the pass-through character of freight rates for an<br />
asset-light service provider like <strong>Panalpina</strong>. Moreover, average<br />
jet fuel and bunker prices in <strong>2010</strong> were more than<br />
20 % above 2009 levels, resulting in distinctly higher fuel<br />
and bunker surcharges (essentially also items with<br />
a pass-through character) which the Group invoiced to<br />
its customers.<br />
3,000<br />
2,500<br />
2,000<br />
1,500<br />
1,000<br />
500<br />
0<br />
3,503<br />
2,714<br />
2,771<br />
2,360<br />
890<br />
884<br />
Air Freight Ocean Freight Logistics<br />
Net forwarding revenue per segment (<strong>2010</strong>)<br />
Air Freight<br />
49%<br />
Ocean Freight<br />
39%<br />
Logistics<br />
12%<br />
<strong>Panalpina</strong> <strong>Annual</strong> <strong>Report</strong> <strong>2010</strong>