Annual Report 2010 (PDF, 5.2MB) - Panalpina Annual Report 2012
Annual Report 2010 (PDF, 5.2MB) - Panalpina Annual Report 2012
Annual Report 2010 (PDF, 5.2MB) - Panalpina Annual Report 2012

Create successful ePaper yourself
Turn your PDF publications into a flip-book with our unique Google optimized e-Paper software.
<strong>Report</strong>s of the Board of Directors and the Executive Board<br />
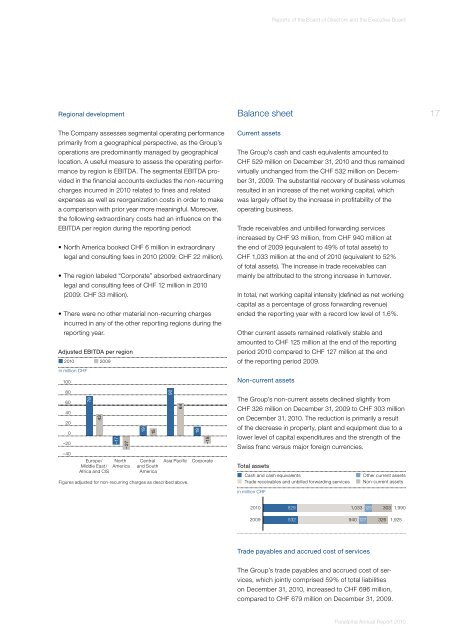
Regional development<br />
The Company assesses segmental operating performance<br />
primarily from a geographical perspective, as the Group’s<br />
operations are predominantly managed by geographical<br />
location. A useful measure to assess the operating performance<br />
by region is EBITDA. The segmental EBITDA provided<br />
in the financial accounts excludes the non-recurring<br />
charges incurred in <strong>2010</strong> related to fines and related<br />
expenses as well as reorganization costs in order to make<br />
a comparison with prior year more meaningful. Moreover,<br />
the following extraordinary costs had an influence on the<br />
EBITDA per region during the reporting period:<br />
• North America booked CHF 6 million in extraordinary<br />
legal and consulting fees in <strong>2010</strong> (2009: CHF 22 million).<br />
• The region labeled “Corporate” absorbed extraordinary<br />
legal and consulting fees of CHF 12 million in <strong>2010</strong><br />
(2009: CHF 33 million).<br />
• There were no other material non-recurring charges<br />
incurred in any of the other reporting regions during the<br />
reporting year.<br />
Adjusted EBITDA per region<br />
<strong>2010</strong> 2009<br />
in million CHF<br />
100<br />
Balance sheet<br />
Current assets<br />
The Group’s cash and cash equivalents amounted to<br />
CHF 529 million on December 31, <strong>2010</strong> and thus remained<br />
virtually unchanged from the CHF 532 million on December<br />
31, 2009. The substantial recovery of business volumes<br />
resulted in an increase of the net working capital, which<br />
was largely offset by the increase in profitability of the<br />
operating business.<br />
Trade receivables and unbilled forwarding services<br />
increased by CHF 93 million, from CHF 940 million at<br />
the end of 2009 (equivalent to 49 % of total assets) to<br />
CHF 1,033 million at the end of <strong>2010</strong> (equivalent to 52 %<br />
of total assets). The increase in trade receivables can<br />
mainly be attributed to the strong increase in turnover.<br />
In total, net working capital intensity (defined as net working<br />
capital as a percentage of gross forwarding revenue)<br />
ended the reporting year with a record low level of 1.6 %.<br />
Other current assets remained relatively stable and<br />
amounted to CHF 125 million at the end of the reporting<br />
period <strong>2010</strong> compared to CHF 127 million at the end<br />
of the reporting period 2009.<br />
Non-current assets<br />
17<br />
80<br />
60<br />
40<br />
20<br />
0<br />
–20<br />
–40<br />
78<br />
43<br />
Europe/<br />
Middle East/<br />
Africa and CIS<br />
–17<br />
–27<br />
North<br />
America<br />
Figures adjusted for non-recurring charges as described above.<br />
19<br />
15<br />
Central<br />
and South<br />
America<br />
92<br />
64<br />
Asia Pacific<br />
18<br />
–15<br />
Corporate<br />
The Group’s non-current assets declined slightly from<br />
CHF 326 million on December 31, 2009 to CHF 303 million<br />
on December 31, <strong>2010</strong>. The reduction is primarily a result<br />
of the decrease in property, plant and equipment due to a<br />
lower level of capital expenditures and the strength of the<br />
Swiss franc versus major foreign currencies.<br />
Total assets<br />
Cash and cash equivalents<br />
Trade receivables and unbilled forwarding services<br />
in million CHF<br />
Other current assets<br />
Non-current assets<br />
<strong>2010</strong><br />
2009<br />
529 1,033 125 303 1,990<br />
532 940 127 326 1,925<br />
Trade payables and accrued cost of services<br />
The Group’s trade payables and accrued cost of services,<br />
which jointly comprised 59 % of total liabilities<br />
on December 31, <strong>2010</strong>, increased to CHF 696 million,<br />
compared to CHF 679 million on December 31, 2009.<br />
<strong>Panalpina</strong> <strong>Annual</strong> <strong>Report</strong> <strong>2010</strong>