Annual Report 2010 (PDF, 5.2MB) - Panalpina Annual Report 2012
Annual Report 2010 (PDF, 5.2MB) - Panalpina Annual Report 2012
Annual Report 2010 (PDF, 5.2MB) - Panalpina Annual Report 2012

Create successful ePaper yourself
Turn your PDF publications into a flip-book with our unique Google optimized e-Paper software.
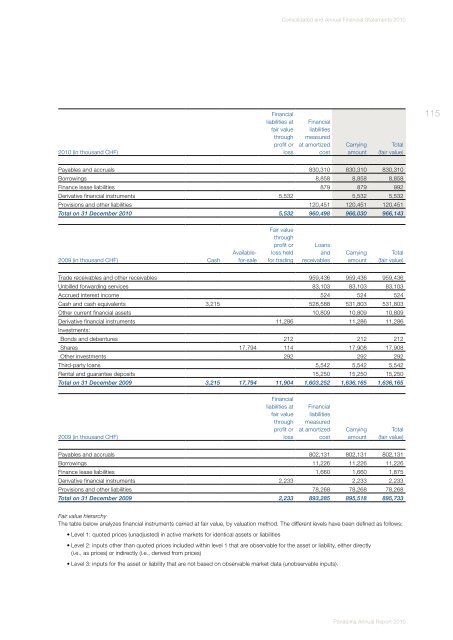
Consolidated and <strong>Annual</strong> Financial Statements <strong>2010</strong><br />
<strong>2010</strong> (in thousand CHF)<br />
Financial<br />
liabilities at<br />
fair value<br />
through<br />
profit or<br />
loss<br />
Financial<br />
liabilities<br />
measured<br />
at amortized<br />
cost<br />
Carrying<br />
amount<br />
Total<br />
(fair value)<br />
115<br />
Payables and accruals 830,310 830,310 830,310<br />
Borrowings 8,858 8,858 8,858<br />
Finance lease liabilities 879 879 992<br />
Derivative financial instruments 5,532 5,532 5,532<br />
Provisions and other liabilities 120,451 120,451 120,451<br />
Total on 31 December <strong>2010</strong> 5,532 960,498 966,030 966,143<br />
2009 (in thousand CHF) Cash<br />
Availablefor-sale<br />
Fair value<br />
through<br />
profit or<br />
loss held<br />
for trading<br />
Loans<br />
and<br />
receivables<br />
Carrying<br />
amount<br />
Total<br />
(fair value)<br />
Trade receivables and other receivables 959,436 959,436 959,436<br />
Unbilled forwarding services 83,103 83,103 83,103<br />
Accrued interest income 524 524 524<br />
Cash and cash equivalents 3,215 528,588 531,803 531,803<br />
Other current financial assets 10,809 10,809 10,809<br />
Derivative financial instruments 11,286 11,286 11,286<br />
Investments:<br />
Bonds and debentures 212 212 212<br />
Shares 17,794 114 17,908 17,908<br />
Other investments 292 292 292<br />
Third-party loans 5,542 5,542 5,542<br />
Rental and guarantee deposits 15,250 15,250 15,250<br />
Total on 31 December 2009 3,215 17,794 11,904 1,603,252 1,636,165 1,636,165<br />
2009 (in thousand CHF)<br />
Financial<br />
liabilities at<br />
fair value<br />
through<br />
profit or<br />
loss<br />
Financial<br />
liabilities<br />
measured<br />
at amortized<br />
cost<br />
Carrying<br />
amount<br />
Total<br />
(fair value)<br />
Payables and accruals 802,131 802,131 802,131<br />
Borrowings 11,226 11,226 11,226<br />
Finance lease liabilities 1,660 1,660 1,875<br />
Derivative financial instruments 2,233 2,233 2,233<br />
Provisions and other liabilities 78,268 78,268 78,268<br />
Total on 31 December 2009 2,233 893,285 895,518 895,733<br />
Fair value hierarchy<br />
The table below analyzes financial instruments carried at fair value, by valuation method. The different levels have been defined as follows:<br />
• Level 1: quoted prices (unadjusted) in active markets for identical assets or liabilities<br />
• Level 2: inputs other than quoted prices included within level 1 that are observable for the asset or liability, either directly<br />
(i.e., as prices) or indirectly (i.e., derived from prices)<br />
• Level 3: inputs for the asset or liability that are not based on observable market data (unobservable inputs).<br />
<strong>Panalpina</strong> <strong>Annual</strong> <strong>Report</strong> <strong>2010</strong>