Download the documentation - True BASIC
Download the documentation - True BASIC
Download the documentation - True BASIC

You also want an ePaper? Increase the reach of your titles
YUMPU automatically turns print PDFs into web optimized ePapers that Google loves.
116 Statistics Graphics Toolkit<br />
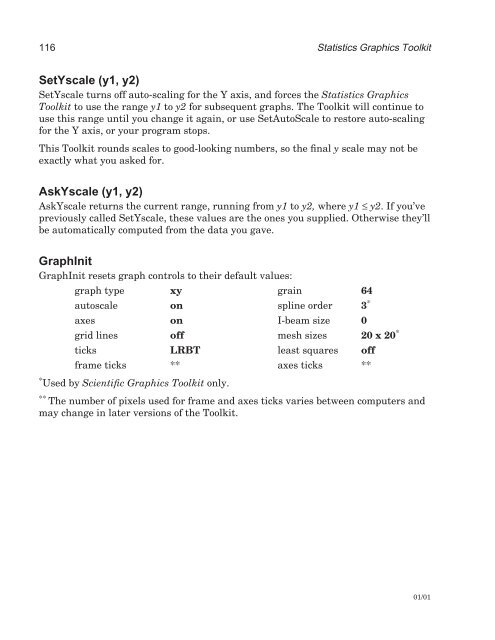
SetYscale (y1, y2)<br />
SetYscale turns off auto-scaling for <strong>the</strong> Y axis, and forces <strong>the</strong> Statistics Graphics<br />
Toolkit to use <strong>the</strong> range y1 to y2 for subsequent graphs. The Toolkit will continue to<br />
use this range until you change it again, or use SetAutoScale to restore auto-scaling<br />
for <strong>the</strong> Y axis, or your program stops.<br />
This Toolkit rounds scales to good-looking numbers, so <strong>the</strong> final y scale may not be<br />
exactly what you asked for.<br />
AskYscale (y1, y2)<br />
AskYscale returns <strong>the</strong> current range, running from y1 to y2, where y1 ≤ y2. If you’ve<br />
previously called SetYscale, <strong>the</strong>se values are <strong>the</strong> ones you supplied. O<strong>the</strong>rwise <strong>the</strong>y’ll<br />
be automatically computed from <strong>the</strong> data you gave.<br />
GraphInit<br />
GraphInit resets graph controls to <strong>the</strong>ir default values:<br />
graph type xy grain 64<br />
autoscale on spline order 3 *<br />
axes on I-beam size 0<br />
grid lines off mesh sizes 20 x 20 *<br />
ticks LRBT least squares off<br />
frame ticks ** axes ticks **<br />
* Used by Scientific Graphics Toolkit only.<br />
**<br />
The number of pixels used for frame and axes ticks varies between computers and<br />
may change in later versions of <strong>the</strong> Toolkit.<br />
01/01