Download the documentation - True BASIC
Download the documentation - True BASIC
Download the documentation - True BASIC

You also want an ePaper? Increase the reach of your titles
YUMPU automatically turns print PDFs into web optimized ePapers that Google loves.
40 Statistics Graphics Toolkit<br />
than from go in a “lo” bar centered at from-step; high values go in a “hi” bar centered<br />
one step beyond <strong>the</strong> interval’s end. These bars are flagged with labels lo or hi if nonempty.<br />
The rules governing from, to, and step are described in <strong>the</strong> “Frequency Datasets”<br />
section. Any missing values in data() are ignored. The color scheme col$ is treated as<br />
usual, so a scheme like “red green blue” gives a red title, green frame, and blue<br />
histogram.<br />
Call SetNormal(1) to automatically superimpose cumulative normal curves on subsequent<br />
histograms. See its description at <strong>the</strong> end of this section.<br />
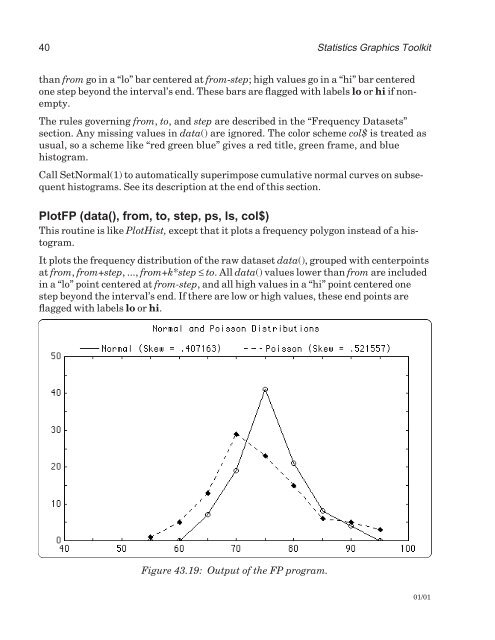
PlotFP (data(), from, to, step, ps, ls, col$)<br />
This routine is like PlotHist, except that it plots a frequency polygon instead of a histogram.<br />
It plots <strong>the</strong> frequency distribution of <strong>the</strong> raw dataset data(), grouped with centerpoints<br />
at from, from+step, ..., from+k*step ≤ to. All data() values lower than from are included<br />
in a “lo” point centered at from-step, and all high values in a “hi” point centered one<br />
step beyond <strong>the</strong> interval’s end. If <strong>the</strong>re are low or high values, <strong>the</strong>se end points are<br />
flagged with labels lo or hi.<br />
Figure 43.19: Output of <strong>the</strong> FP program.<br />
01/01