Download the documentation - True BASIC
Download the documentation - True BASIC
Download the documentation - True BASIC

You also want an ePaper? Increase the reach of your titles
YUMPU automatically turns print PDFs into web optimized ePapers that Google loves.
90 Statistics Graphics Toolkit<br />
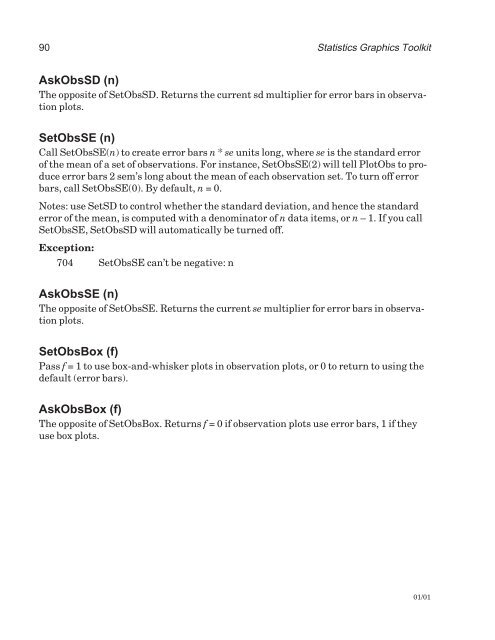
AskObsSD (n)<br />
The opposite of SetObsSD. Returns <strong>the</strong> current sd multiplier for error bars in observation<br />
plots.<br />
SetObsSE (n)<br />
Call SetObsSE(n) to create error bars n * se units long, where se is <strong>the</strong> standard error<br />
of <strong>the</strong> mean of a set of observations. For instance, SetObsSE(2) will tell PlotObs to produce<br />
error bars 2 sem’s long about <strong>the</strong> mean of each observation set. To turn off error<br />
bars, call SetObsSE(0). By default, n = 0.<br />
Notes: use SetSD to control whe<strong>the</strong>r <strong>the</strong> standard deviation, and hence <strong>the</strong> standard<br />
error of <strong>the</strong> mean, is computed with a denominator of n data items, or n – 1. If you call<br />
SetObsSE, SetObsSD will automatically be turned off.<br />
Exception:<br />
704 SetObsSE can’t be negative: n<br />
AskObsSE (n)<br />
The opposite of SetObsSE. Returns <strong>the</strong> current se multiplier for error bars in observation<br />
plots.<br />
SetObsBox (f)<br />
Pass f = 1 to use box-and-whisker plots in observation plots, or 0 to return to using <strong>the</strong><br />
default (error bars).<br />
AskObsBox (f)<br />
The opposite of SetObsBox. Returns f = 0 if observation plots use error bars, 1 if <strong>the</strong>y<br />
use box plots.<br />
01/01