Download the documentation - True BASIC
Download the documentation - True BASIC
Download the documentation - True BASIC
You also want an ePaper? Increase the reach of your titles
YUMPU automatically turns print PDFs into web optimized ePapers that Google loves.
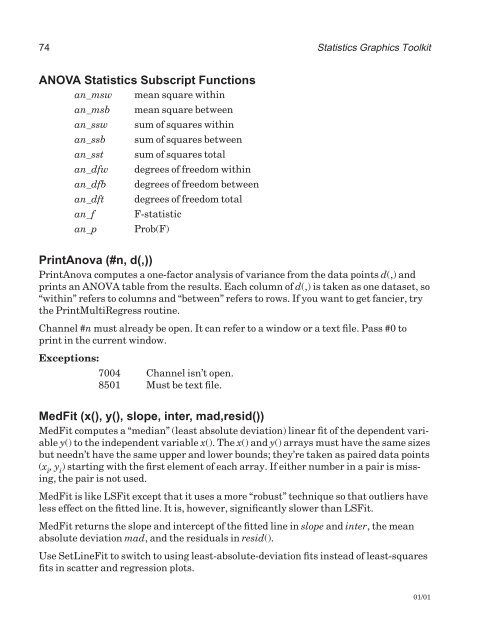
74 Statistics Graphics Toolkit<br />
ANOVA Statistics Subscript Functions<br />
an_msw mean square within<br />
an_msb<br />
an_ssw<br />
an_ssb<br />
an_sst<br />
an_dfw<br />
an_dfb<br />
an_dft<br />
an_f<br />
an_p<br />
mean square between<br />
sum of squares within<br />
sum of squares between<br />
sum of squares total<br />
degrees of freedom within<br />
degrees of freedom between<br />
degrees of freedom total<br />
F-statistic<br />
Prob(F)<br />
PrintAnova (#n, d(,))<br />
PrintAnova computes a one-factor analysis of variance from <strong>the</strong> data points d(,) and<br />
prints an ANOVA table from <strong>the</strong> results. Each column of d(,) is taken as one dataset, so<br />
“within” refers to columns and “between” refers to rows. If you want to get fancier, try<br />
<strong>the</strong> PrintMultiRegress routine.<br />
Channel #n must already be open. It can refer to a window or a text file. Pass #0 to<br />
print in <strong>the</strong> current window.<br />
Exceptions:<br />
7004 Channel isn’t open.<br />
8501 Must be text file.<br />
MedFit (x(), y(), slope, inter, mad,resid())<br />
MedFit computes a “median” (least absolute deviation) linear fit of <strong>the</strong> dependent variable<br />
y() to <strong>the</strong> independent variable x(). The x() and y() arrays must have <strong>the</strong> same sizes<br />
but needn’t have <strong>the</strong> same upper and lower bounds; <strong>the</strong>y’re taken as paired data points<br />
(x i<br />
, y i<br />
) starting with <strong>the</strong> first element of each array. If ei<strong>the</strong>r number in a pair is missing,<br />
<strong>the</strong> pair is not used.<br />
MedFit is like LSFit except that it uses a more “robust” technique so that outliers have<br />
less effect on <strong>the</strong> fitted line. It is, however, significantly slower than LSFit.<br />
MedFit returns <strong>the</strong> slope and intercept of <strong>the</strong> fitted line in slope and inter, <strong>the</strong> mean<br />
absolute deviation mad, and <strong>the</strong> residuals in resid().<br />
Use SetLineFit to switch to using least-absolute-deviation fits instead of least-squares<br />
fits in scatter and regression plots.<br />
01/01


