Download the documentation - True BASIC
Download the documentation - True BASIC
Download the documentation - True BASIC

Create successful ePaper yourself
Turn your PDF publications into a flip-book with our unique Google optimized e-Paper software.
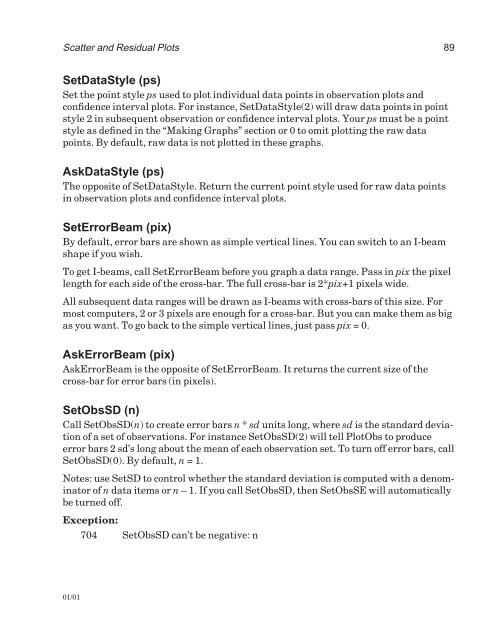
Scatter and Residual Plots 89<br />
SetDataStyle (ps)<br />
Set <strong>the</strong> point style ps used to plot individual data points in observation plots and<br />
confidence interval plots. For instance, SetDataStyle(2) will draw data points in point<br />
style 2 in subsequent observation or confidence interval plots. Your ps must be a point<br />
style as defined in <strong>the</strong> “Making Graphs” section or 0 to omit plotting <strong>the</strong> raw data<br />
points. By default, raw data is not plotted in <strong>the</strong>se graphs.<br />
AskDataStyle (ps)<br />
The opposite of SetDataStyle. Return <strong>the</strong> current point style used for raw data points<br />
in observation plots and confidence interval plots.<br />
SetErrorBeam (pix)<br />
By default, error bars are shown as simple vertical lines. You can switch to an I-beam<br />
shape if you wish.<br />
To get I-beams, call SetErrorBeam before you graph a data range. Pass in pix <strong>the</strong> pixel<br />
length for each side of <strong>the</strong> cross-bar. The full cross-bar is 2*pix+1 pixels wide.<br />
All subsequent data ranges will be drawn as I-beams with cross-bars of this size. For<br />
most computers, 2 or 3 pixels are enough for a cross-bar. But you can make <strong>the</strong>m as big<br />
as you want. To go back to <strong>the</strong> simple vertical lines, just pass pix = 0.<br />
AskErrorBeam (pix)<br />
AskErrorBeam is <strong>the</strong> opposite of SetErrorBeam. It returns <strong>the</strong> current size of <strong>the</strong><br />
cross-bar for error bars (in pixels).<br />
SetObsSD (n)<br />
Call SetObsSD(n) to create error bars n * sd units long, where sd is <strong>the</strong> standard deviation<br />
of a set of observations. For instance SetObsSD(2) will tell PlotObs to produce<br />
error bars 2 sd’s long about <strong>the</strong> mean of each observation set. To turn off error bars, call<br />
SetObsSD(0). By default, n = 1.<br />
Notes: use SetSD to control whe<strong>the</strong>r <strong>the</strong> standard deviation is computed with a denominator<br />
of n data items or n – 1. If you call SetObsSD, <strong>the</strong>n SetObsSE will automatically<br />
be turned off.<br />
Exception:<br />
704 SetObsSD can’t be negative: n<br />
01/01