Download the documentation - True BASIC
Download the documentation - True BASIC
Download the documentation - True BASIC

Create successful ePaper yourself
Turn your PDF publications into a flip-book with our unique Google optimized e-Paper software.
Scatter and Residual Plots 81<br />
See <strong>the</strong> end of this section for more about linear fits, confidence bands, and polynomial<br />
fitting, and <strong>the</strong> “Making Graphs” section for information about color schemes and a list<br />
of point and line styles.<br />
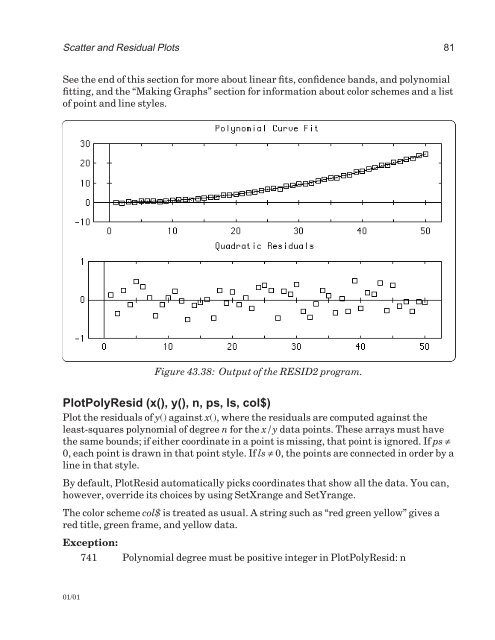
Figure 43.38: Output of <strong>the</strong> RESID2 program.<br />
PlotPolyResid (x(), y(), n, ps, ls, col$)<br />
Plot <strong>the</strong> residuals of y() against x(), where <strong>the</strong> residuals are computed against <strong>the</strong><br />
least-squares polynomial of degree n for <strong>the</strong> x/y data points. These arrays must have<br />
<strong>the</strong> same bounds; if ei<strong>the</strong>r coordinate in a point is missing, that point is ignored. If ps ≠<br />
0, each point is drawn in that point style. If ls ≠ 0, <strong>the</strong> points are connected in order by a<br />
line in that style.<br />
By default, PlotResid automatically picks coordinates that show all <strong>the</strong> data. You can,<br />
however, override its choices by using SetXrange and SetYrange.<br />
The color scheme col$ is treated as usual. A string such as “red green yellow” gives a<br />
red title, green frame, and yellow data.<br />
Exception:<br />
741 Polynomial degree must be positive integer in PlotPolyResid: n<br />
01/01