Download the documentation - True BASIC
Download the documentation - True BASIC
Download the documentation - True BASIC

You also want an ePaper? Increase the reach of your titles
YUMPU automatically turns print PDFs into web optimized ePapers that Google loves.
Box Plots of Observations 87<br />
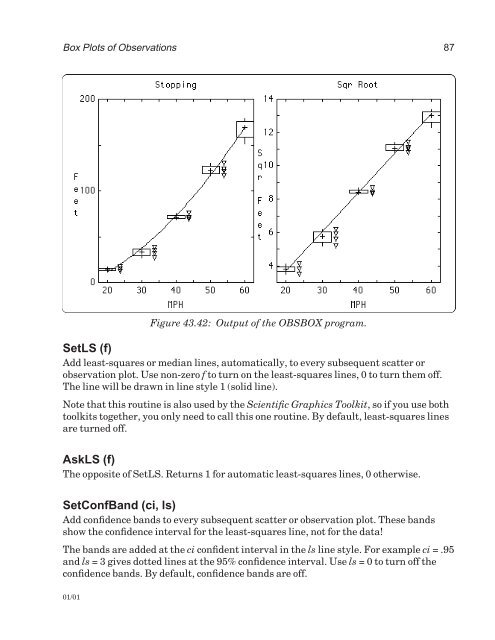
Figure 43.42: Output of <strong>the</strong> OBSBOX program.<br />
SetLS (f)<br />
Add least-squares or median lines, automatically, to every subsequent scatter or<br />
observation plot. Use non-zero f to turn on <strong>the</strong> least-squares lines, 0 to turn <strong>the</strong>m off.<br />
The line will be drawn in line style 1 (solid line).<br />
Note that this routine is also used by <strong>the</strong> Scientific Graphics Toolkit, so if you use both<br />
toolkits toge<strong>the</strong>r, you only need to call this one routine. By default, least-squares lines<br />
are turned off.<br />
AskLS (f)<br />
The opposite of SetLS. Returns 1 for automatic least-squares lines, 0 o<strong>the</strong>rwise.<br />
SetConfBand (ci, ls)<br />
Add confidence bands to every subsequent scatter or observation plot. These bands<br />
show <strong>the</strong> confidence interval for <strong>the</strong> least-squares line, not for <strong>the</strong> data!<br />
The bands are added at <strong>the</strong> ci confident interval in <strong>the</strong> ls line style. For example ci = .95<br />
and ls = 3 gives dotted lines at <strong>the</strong> 95% confidence interval. Use ls = 0 to turn off <strong>the</strong><br />
confidence bands. By default, confidence bands are off.<br />
01/01