Download the documentation - True BASIC
Download the documentation - True BASIC
Download the documentation - True BASIC

Create successful ePaper yourself
Turn your PDF publications into a flip-book with our unique Google optimized e-Paper software.
Simple Statistics 27<br />
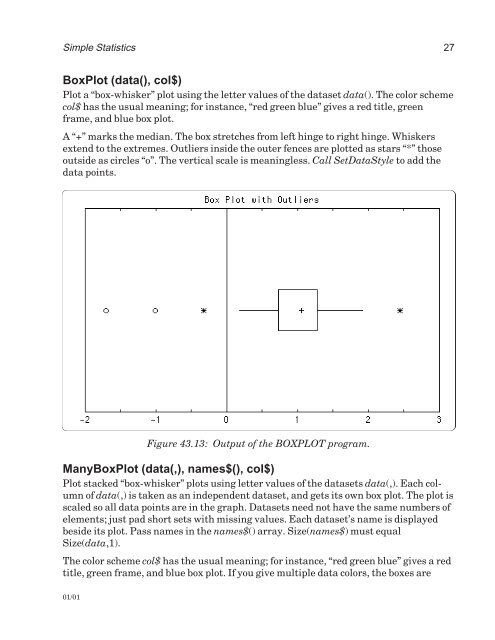
BoxPlot (data(), col$)<br />
Plot a “box-whisker” plot using <strong>the</strong> letter values of <strong>the</strong> dataset data(). The color scheme<br />
col$ has <strong>the</strong> usual meaning; for instance, “red green blue” gives a red title, green<br />
frame, and blue box plot.<br />
A “+” marks <strong>the</strong> median. The box stretches from left hinge to right hinge. Whiskers<br />
extend to <strong>the</strong> extremes. Outliers inside <strong>the</strong> outer fences are plotted as stars “*” those<br />
outside as circles “o”. The vertical scale is meaningless. Call SetDataStyle to add <strong>the</strong><br />
data points.<br />
Figure 43.13: Output of <strong>the</strong> BOXPLOT program.<br />
ManyBoxPlot (data(,), names$(), col$)<br />
Plot stacked “box-whisker” plots using letter values of <strong>the</strong> datasets data(,). Each column<br />
of data(,) is taken as an independent dataset, and gets its own box plot. The plot is<br />
scaled so all data points are in <strong>the</strong> graph. Datasets need not have <strong>the</strong> same numbers of<br />
elements; just pad short sets with missing values. Each dataset’s name is displayed<br />
beside its plot. Pass names in <strong>the</strong> names$() array. Size(names$) must equal<br />
Size(data,1).<br />
The color scheme col$ has <strong>the</strong> usual meaning; for instance, “red green blue” gives a red<br />
title, green frame, and blue box plot. If you give multiple data colors, <strong>the</strong> boxes are<br />
01/01